
Why we're rebuilding the spreadsheet
We made our first product the most boring, most frustrating software we could think of. On purpose. Here's why a spreadsheet was the perfect place to start, and how we cut Excel's ~500 functions down to 76 without losing the power.
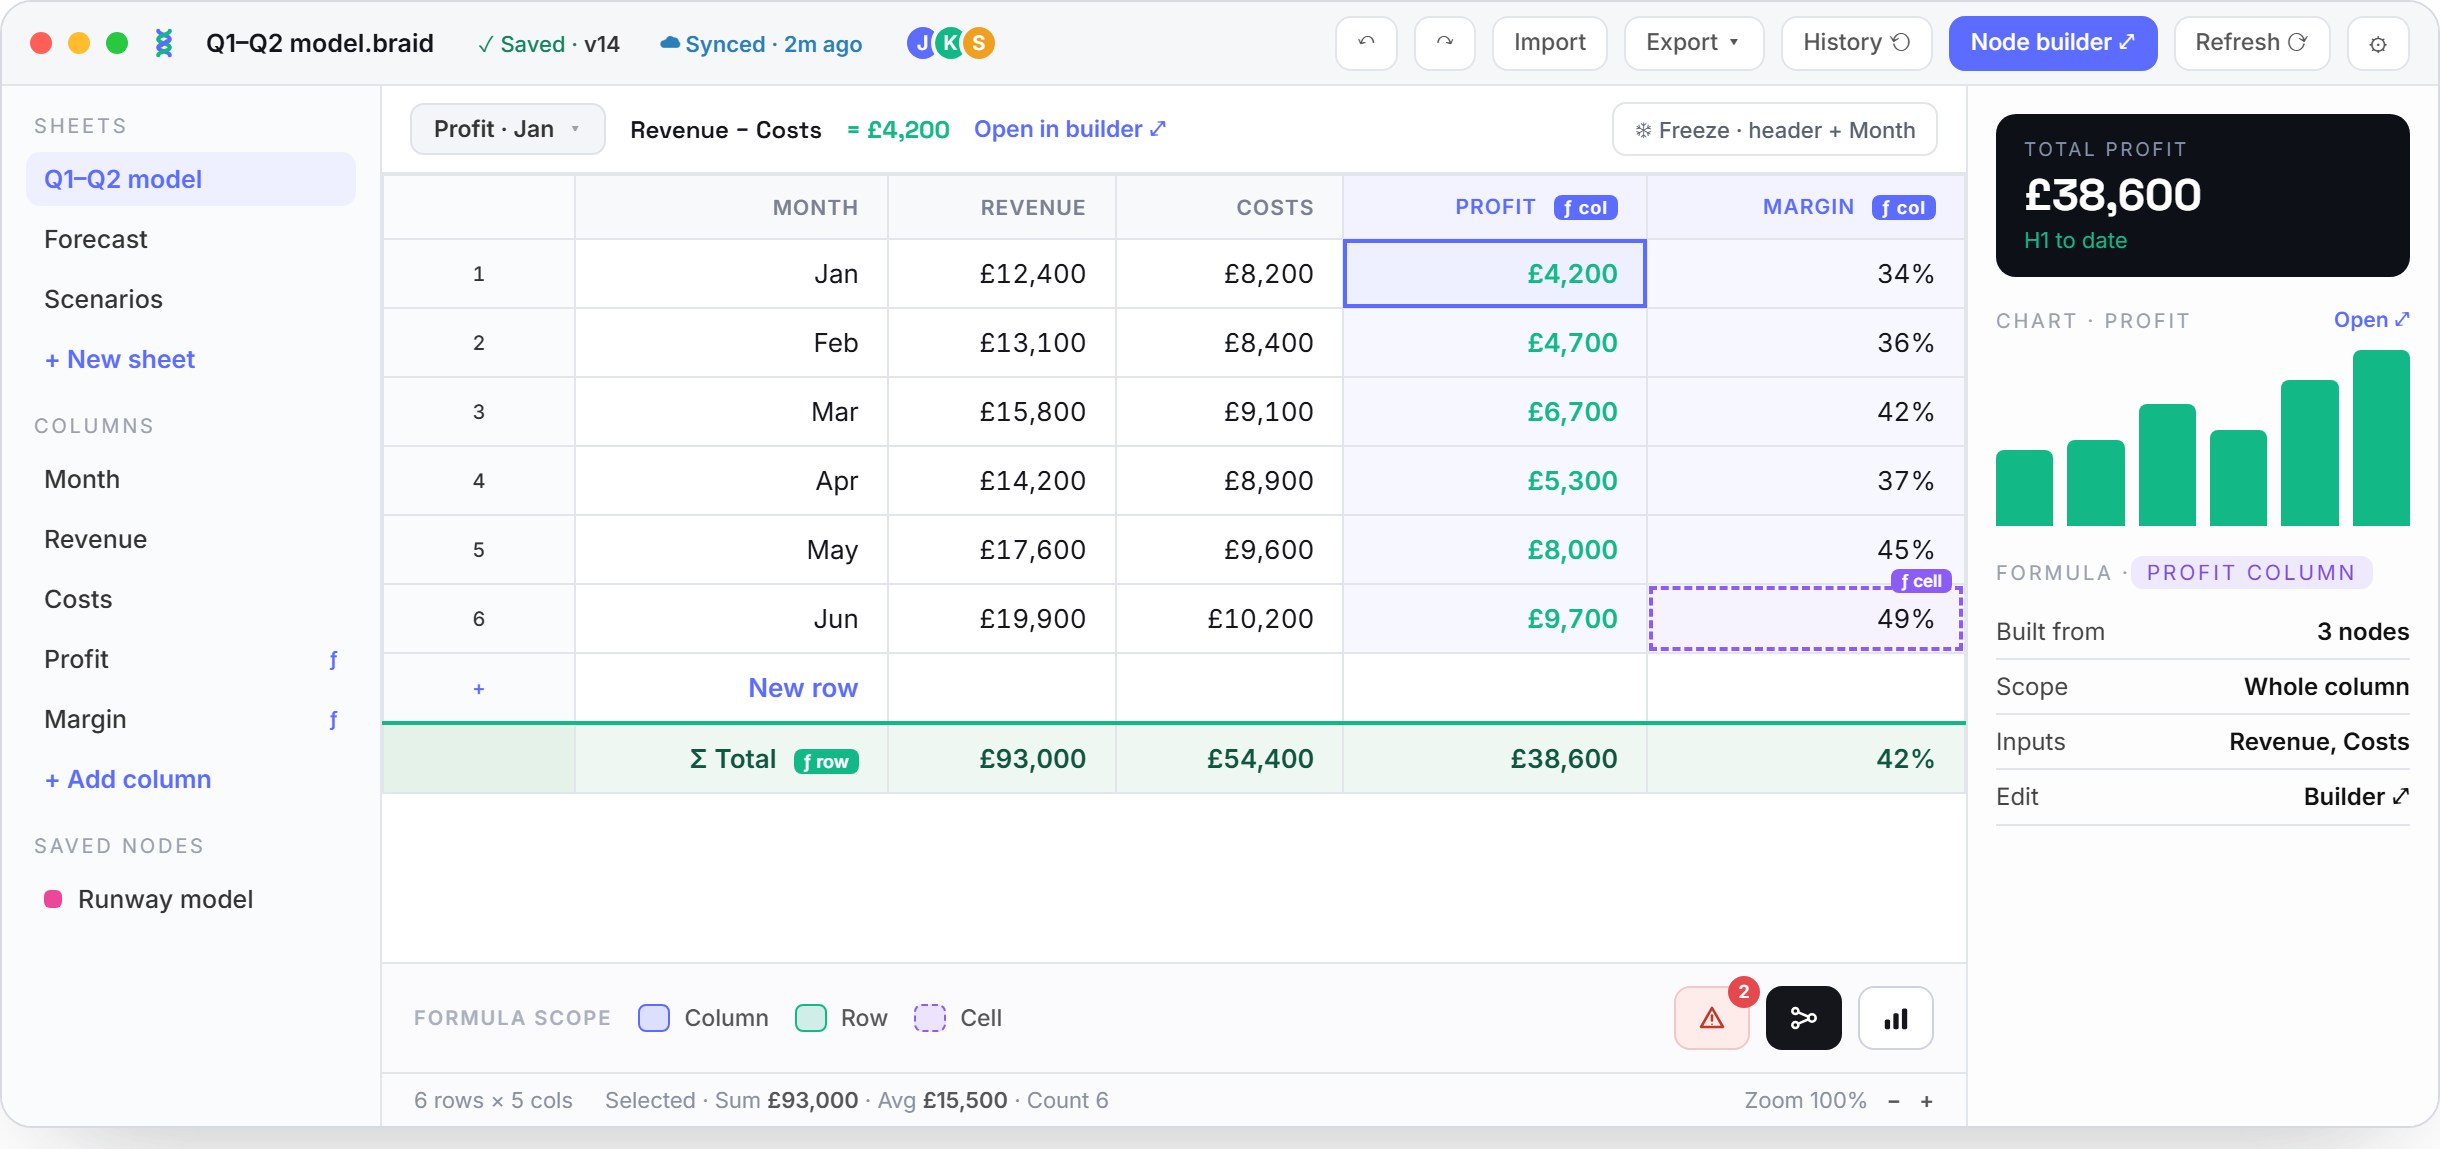
Why start with the most boring software we could find?
A new studio has to prove something, and not that it can chase a trend. It has to prove it has an approach that works, on the hardest possible material. Spreadsheets are exactly that. Everyone knows the pain intimately, the category is decades old and has barely moved, and the bar for "delightful" sits somewhere near the floor.
Which is precisely why it's the perfect first product. If we could take the software people find most tedious and make it feel intuitive, fast, and even beautiful, then the approach is real. Spreadsheets aren't a detour from what Kind Machines is about. They're the clearest possible showcase of it.
The tool nobody chose
Excel won by default, decades ago, and we never really decided to build our businesses on a grid of cells. We just never stopped. The result is a tool that's everywhere and quietly resented: powerful, but hostile; flexible, but fragile; frozen somewhere around 2007.
You feel it every time a colleague sends over a report and you have to guess whether it's the right one. The spreadsheet became infrastructure without ever being designed like it.
The most powerful part of a spreadsheet is also the least accessible part.
Formulas are where the magic lives, and where almost everyone gives up. The moment a task needs more than a column of sums you're into a soup of nested IFs, dollar signs, and #REF! errors that give no hint about what actually broke.
So we counted the entire language
Before designing anything, we did the unglamorous work. We audited the whole thing: every function in Excel, plus every one in Google Sheets that Excel doesn't have. Around five hundred in total. Then we went through each one asking two questions. Does anyone genuinely use this? And can it be expressed more simply?
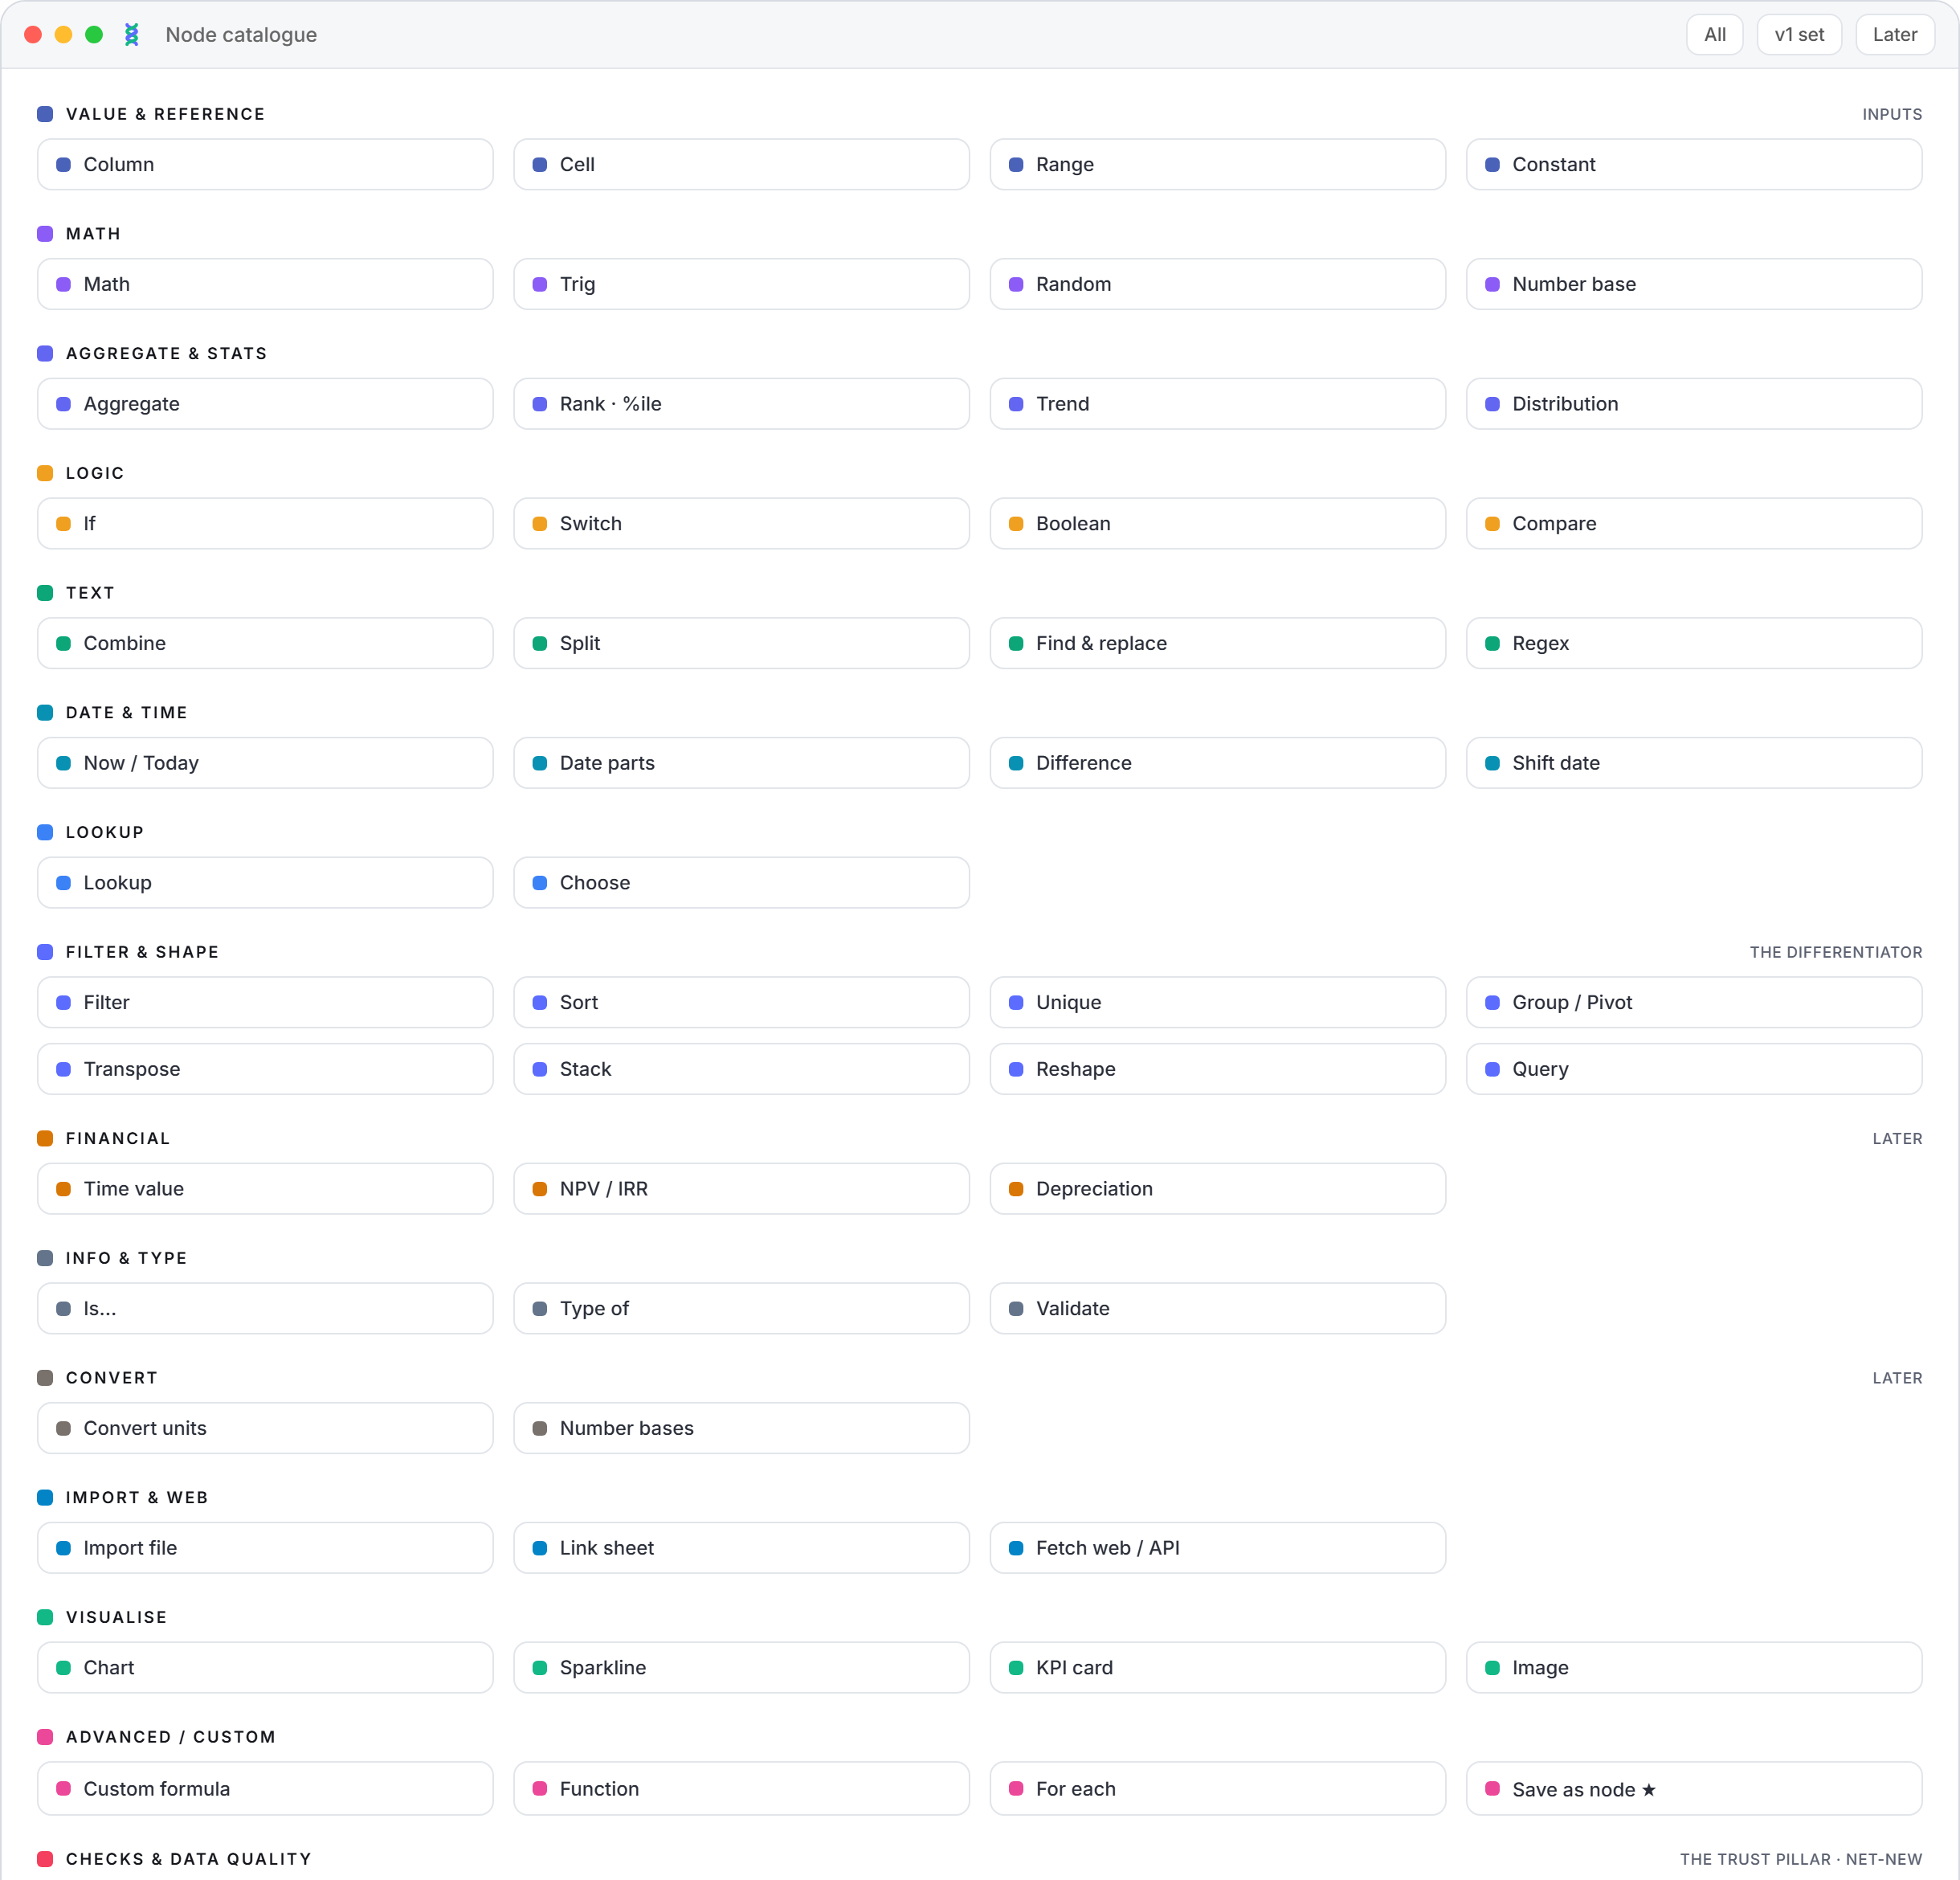
The answers were clarifying. Roughly 85 functions turned out to be legacy duplicates, platform-locked oddities, or engineering-lab maths almost nobody touches, safe to drop without anyone noticing. The rest we rationalised, collapsing whole families into a handful of composable building blocks. SUMIF, SUMIFS, AVERAGEIF and dozens of cousins become one Filter wired into one Aggregate. VLOOKUP, XLOOKUP and INDEX/MATCH become a single Lookup.
Every Excel and Sheets function, rationalised into 76 composable nodes. The same power, a fraction of the surface area, and nothing real left behind.
We didn't strip functionality out; we found that most of the complexity was accidental, not essential. Anything those 76 nodes can't do on their own, you still build; they just compose together instead of multiplying into five hundred special cases.
Same power, made intuitive
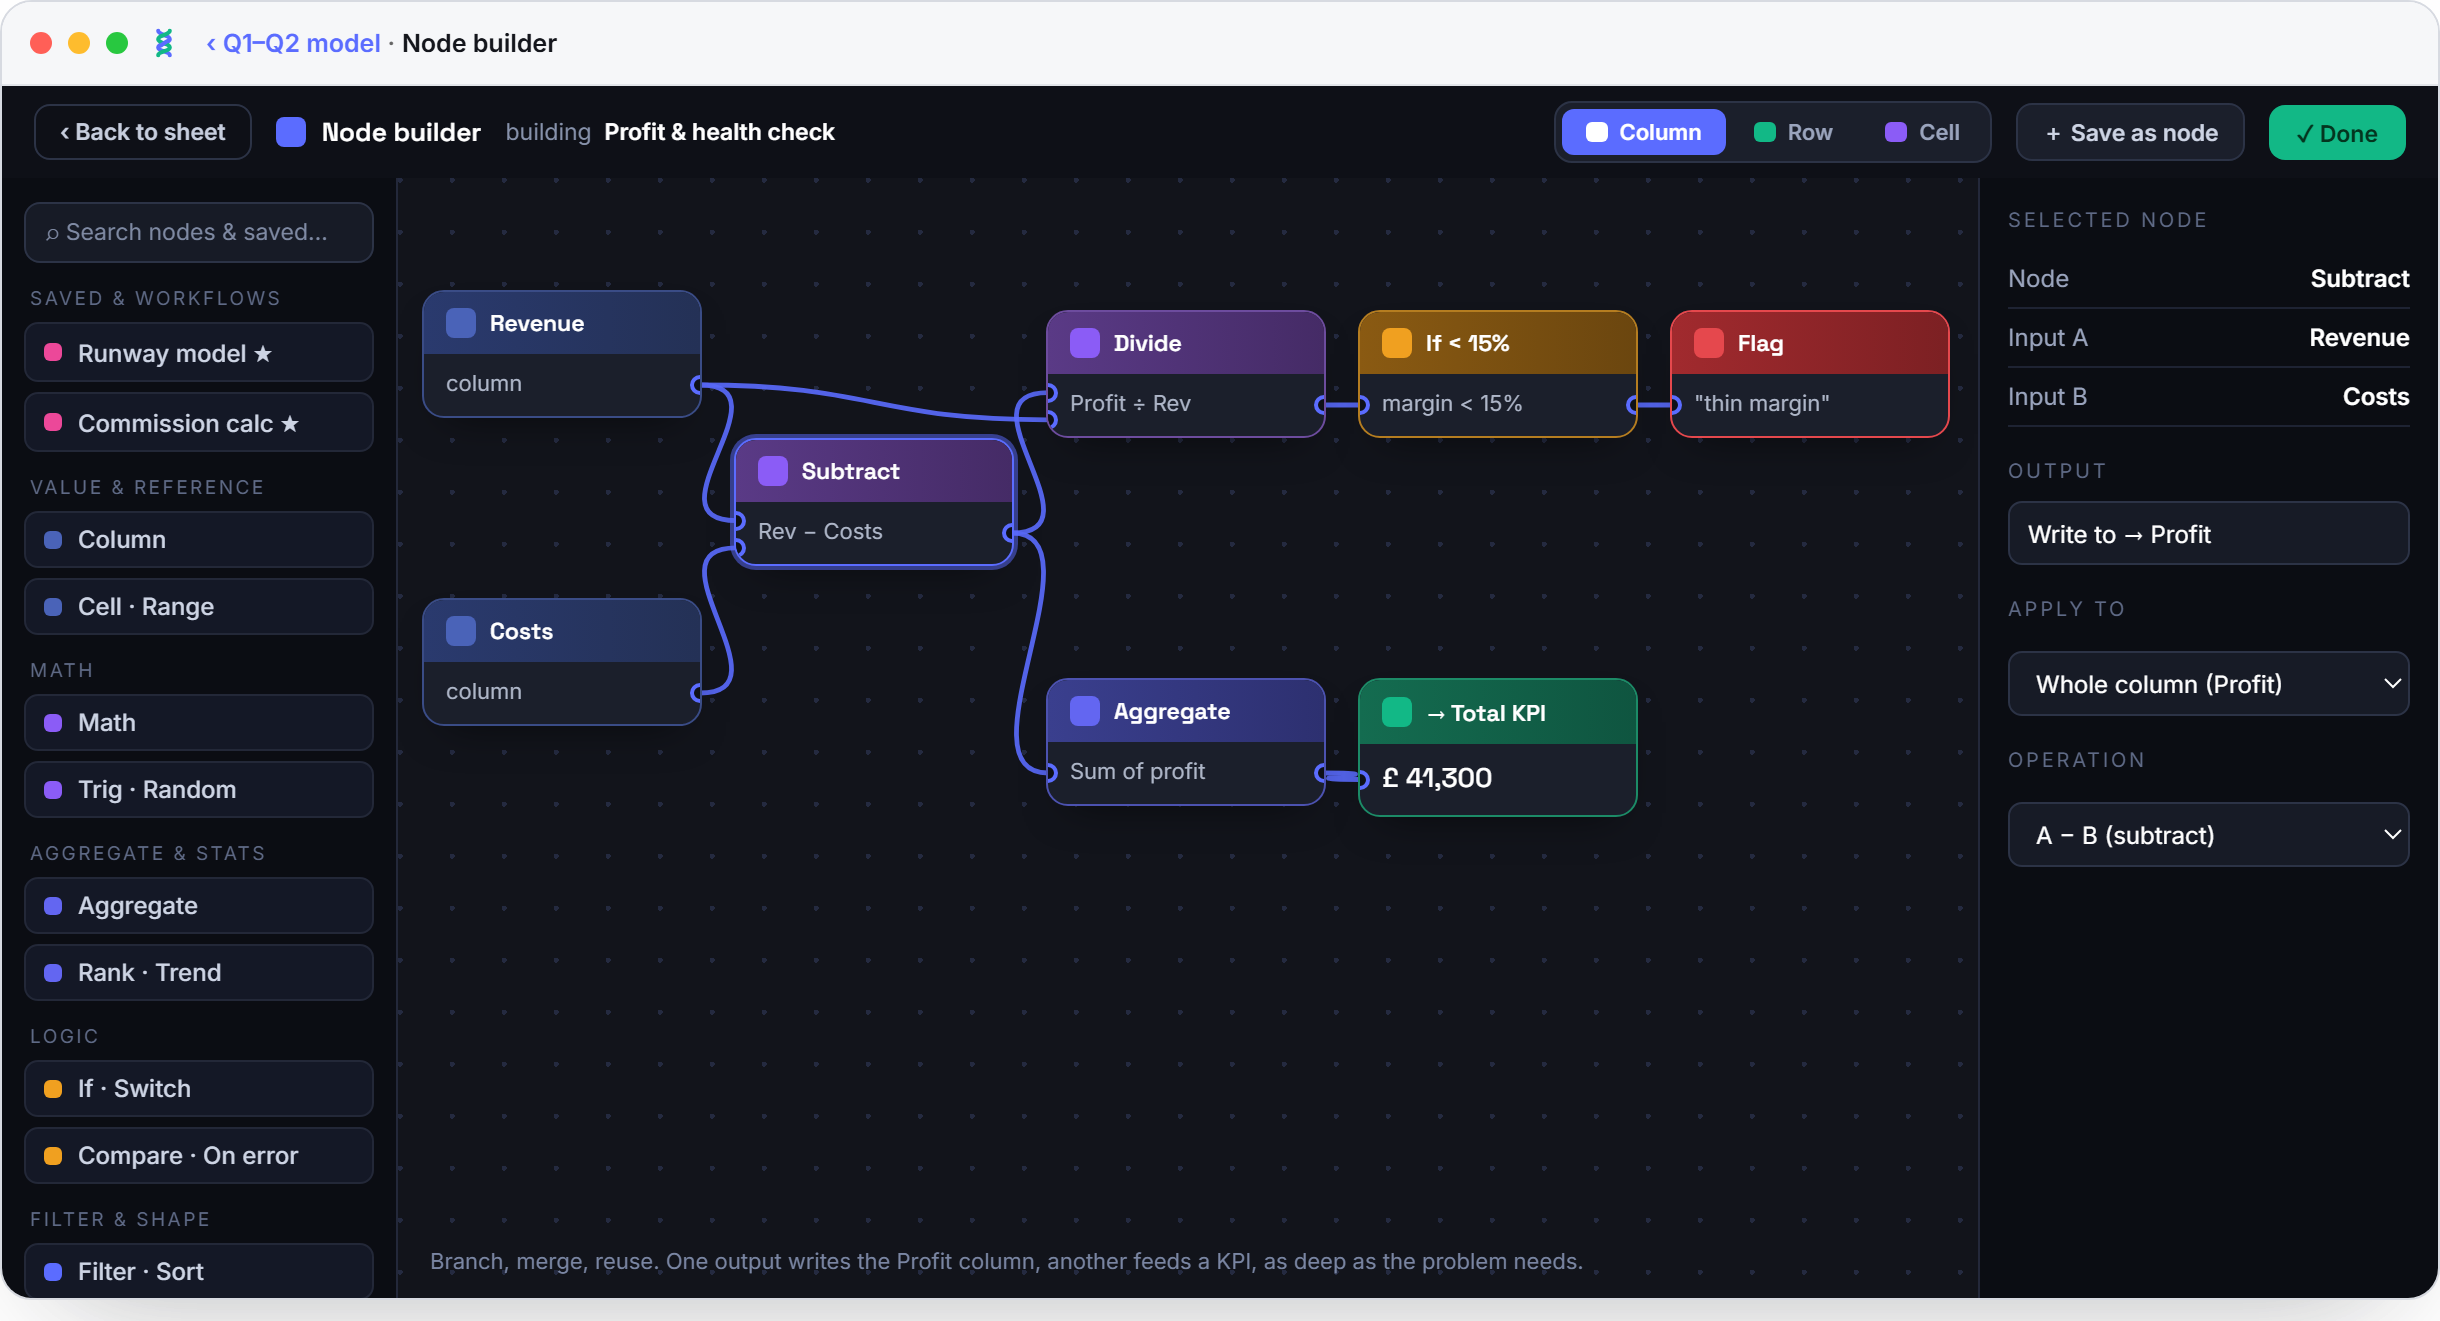
The insight underneath all of it: the logic was never the problem. People can happily think "take revenue, subtract costs, and flag anything below fifteen percent." What breaks is translating that thought into cryptic syntax scattered across invisible cells. So we changed how you touch the power, not the power itself.
You drag nodes onto a canvas, wire them together, and the result flows straight back into your sheet. Every number traces back through the graph that built it, so there are no mystery cells and no hunting for the formula that went wrong. A spreadsheet's full capability, finally something you can see and follow.
And it doesn't stop at formulas
Visual logic is the heart of Braidsheet, but a spreadsheet is only useful if you can see, question, and trust what it's telling you. The same care went into everything around the canvas.
Every column can flow straight into a chart or a KPI card. Because a chart is just another node reading your data, it updates the moment the numbers do, with no copy-paste into a chart and no stale screenshots pasted into a deck.
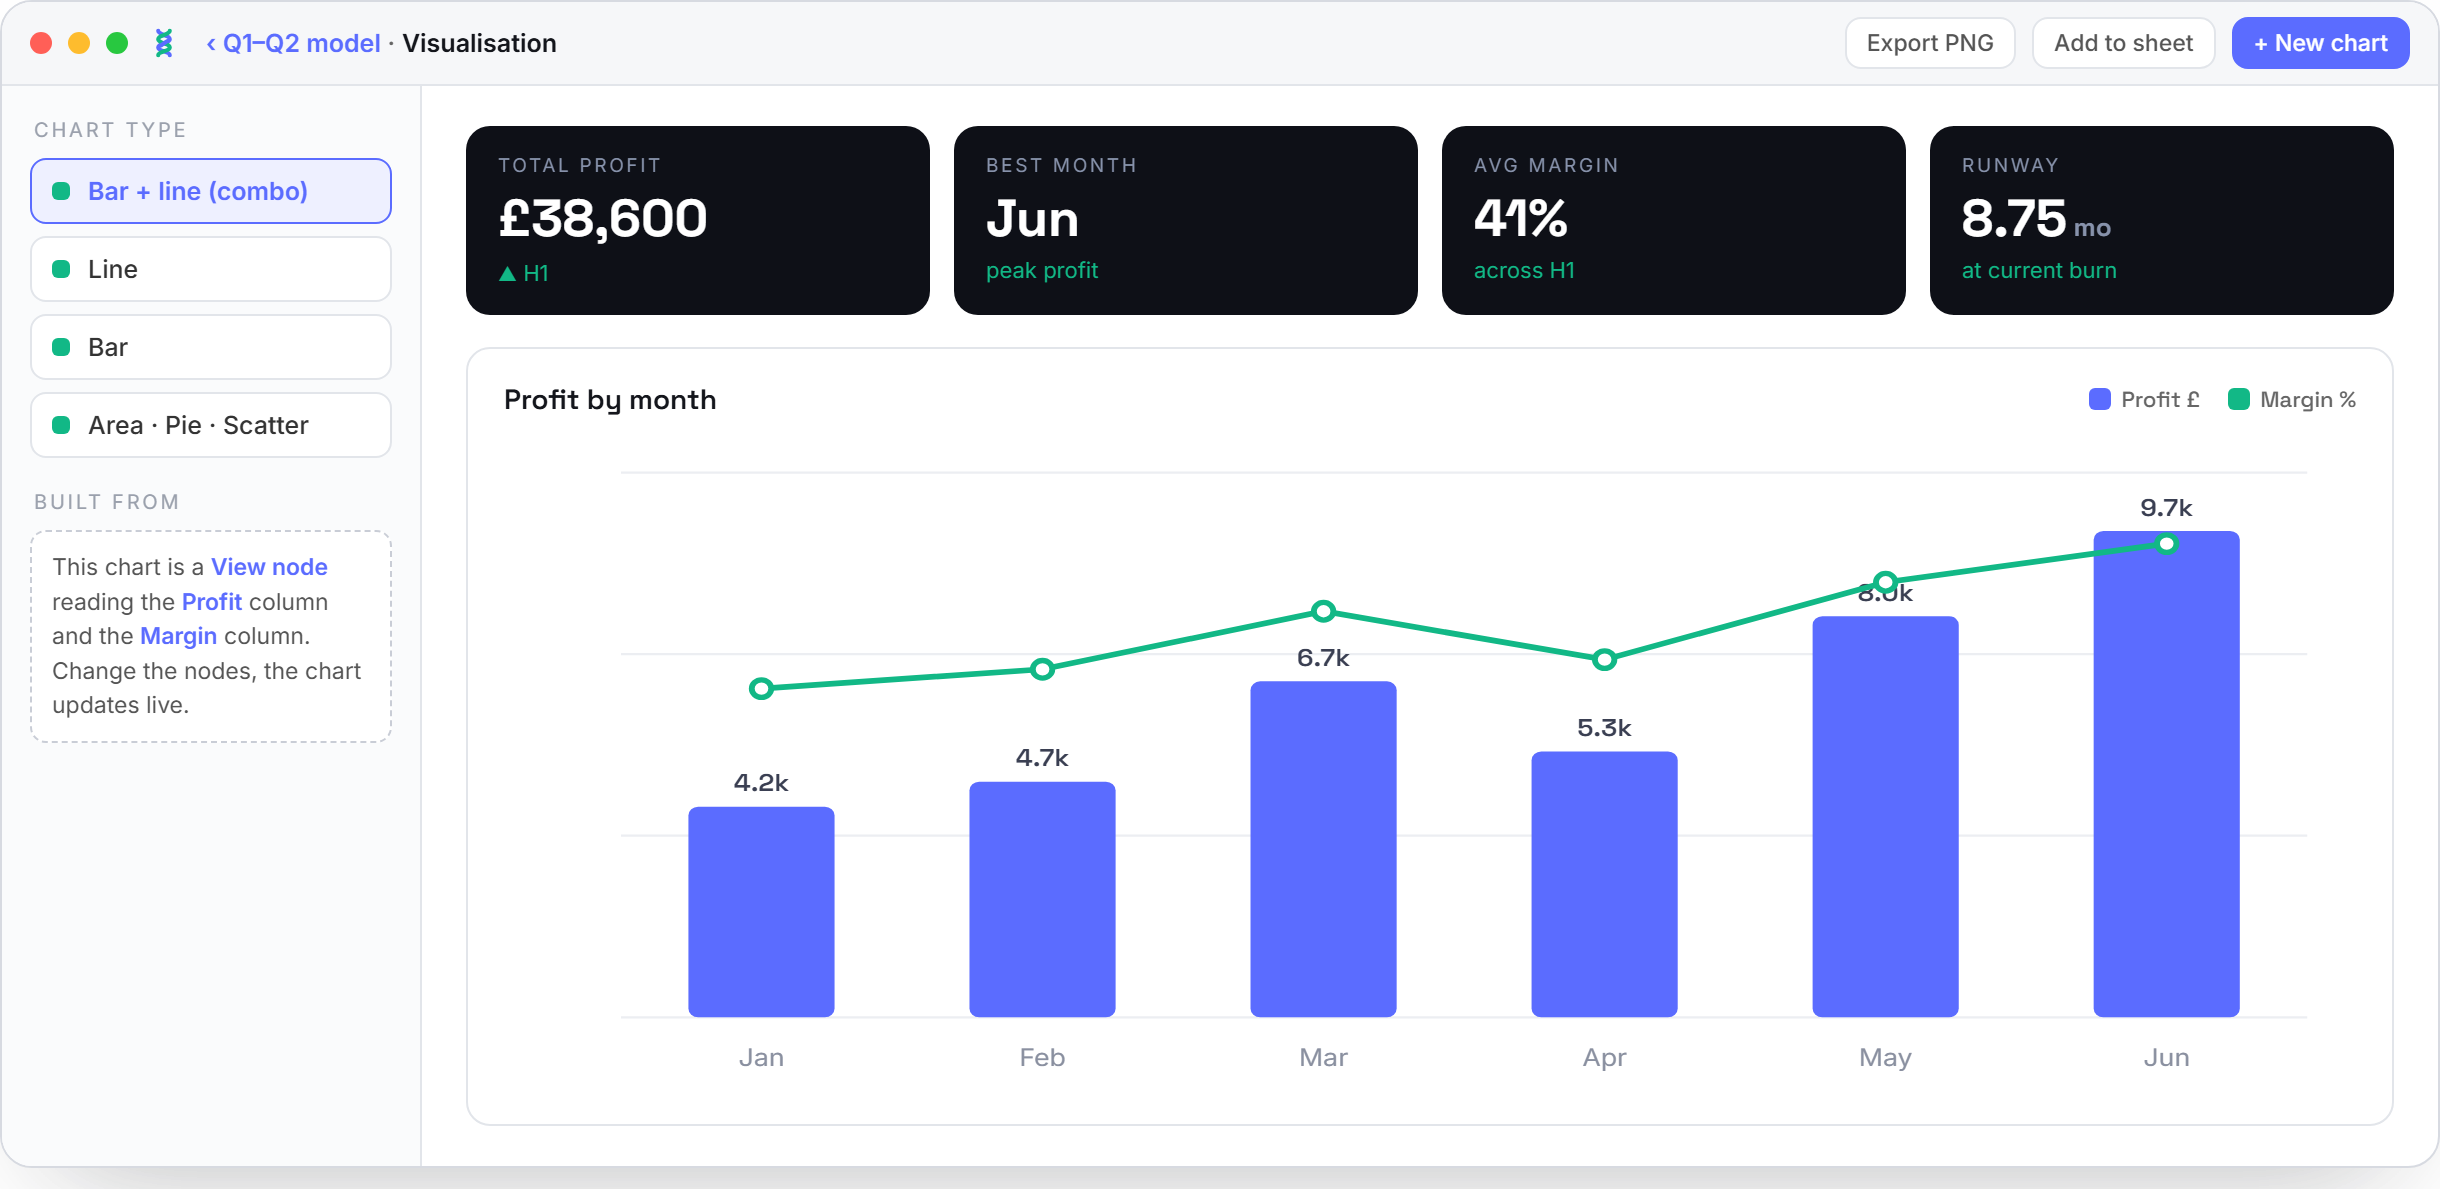
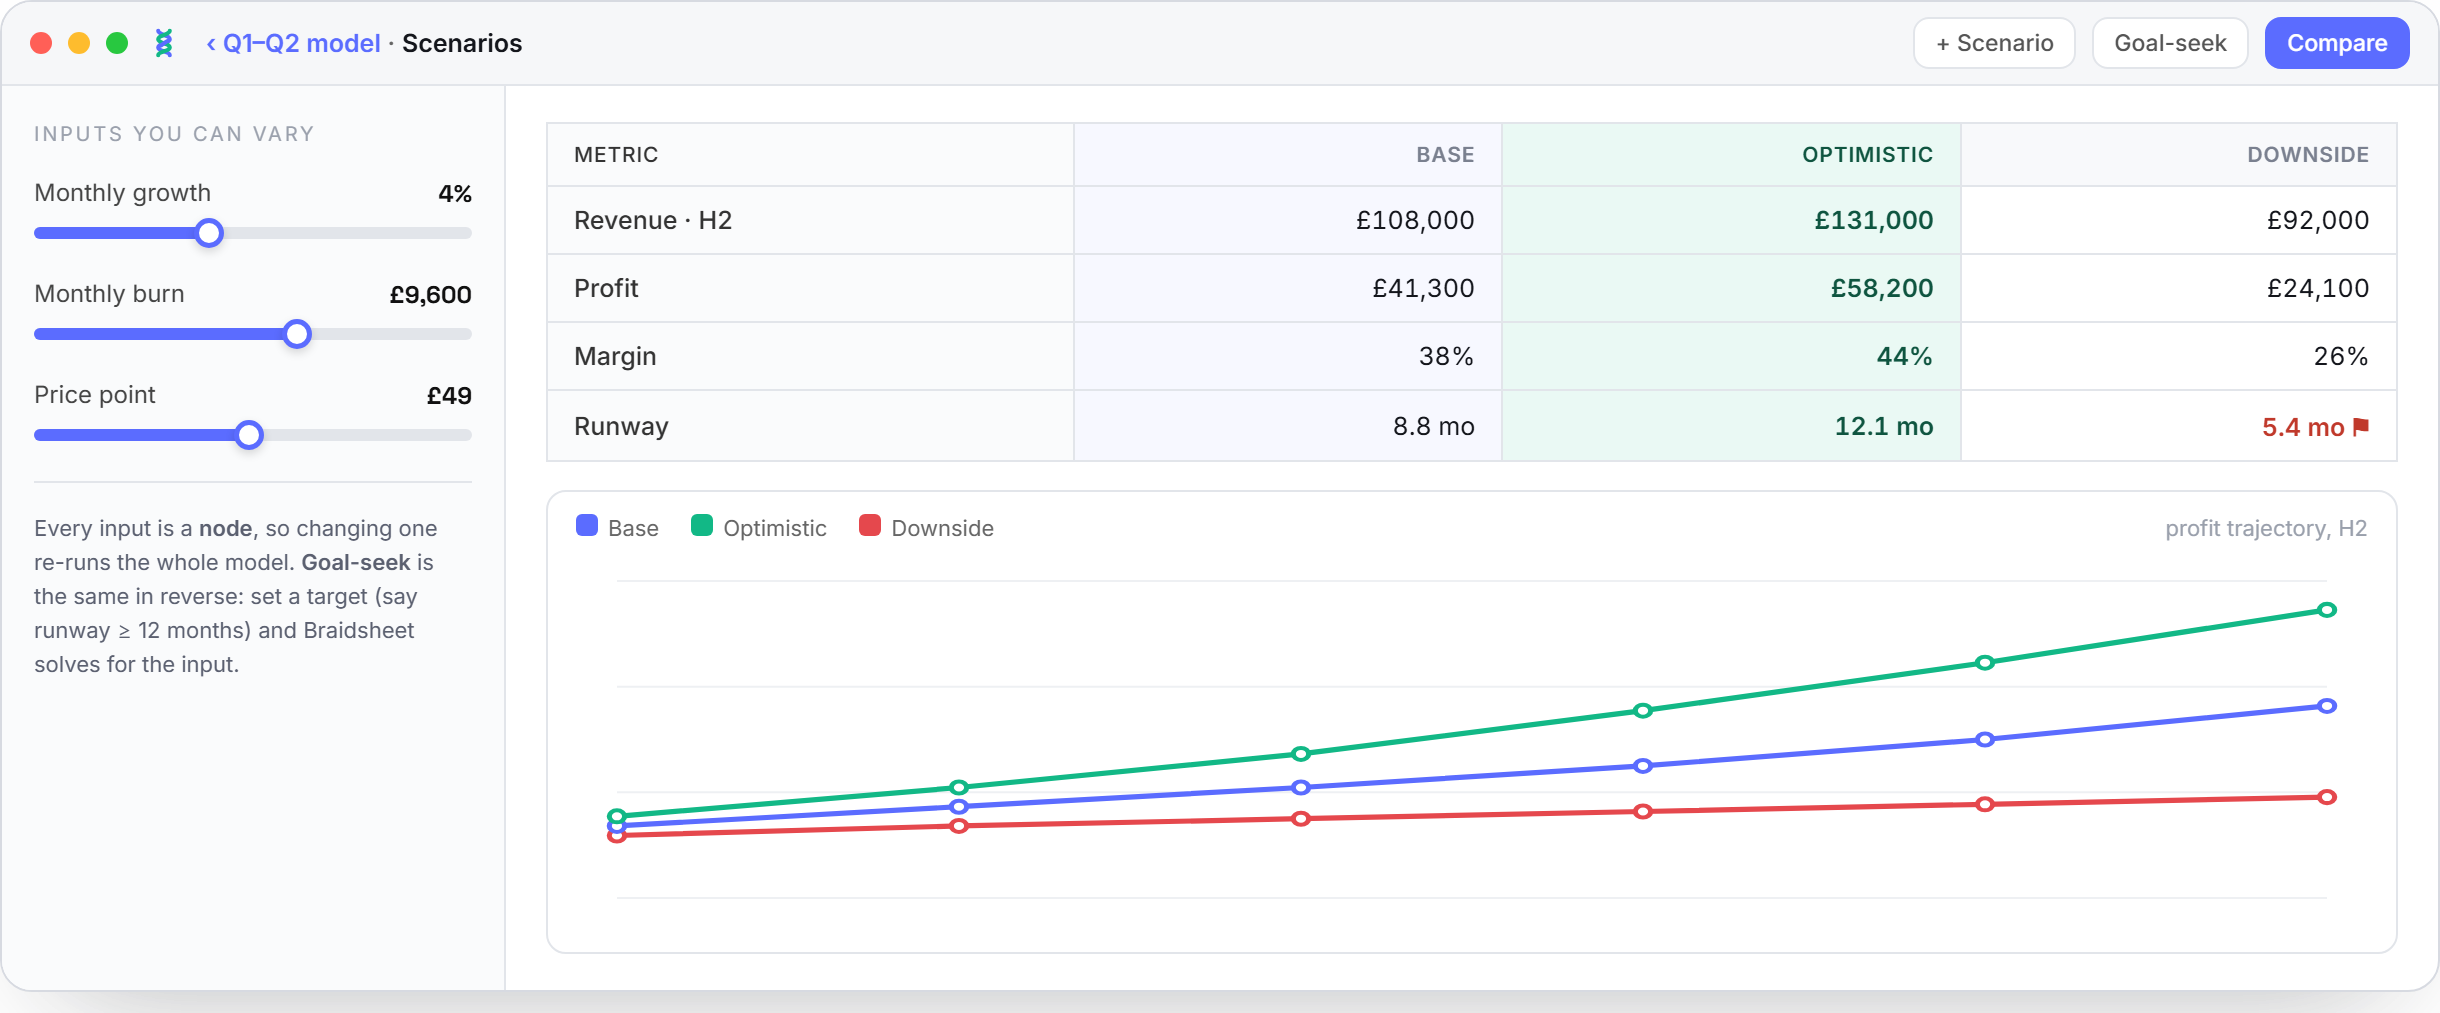
Change one input and Braidsheet re-runs the entire model, so Base, Optimistic and Downside line up next to each other and you watch the outcomes move. Goal-seek runs it in reverse: name the target, and it solves for the input.
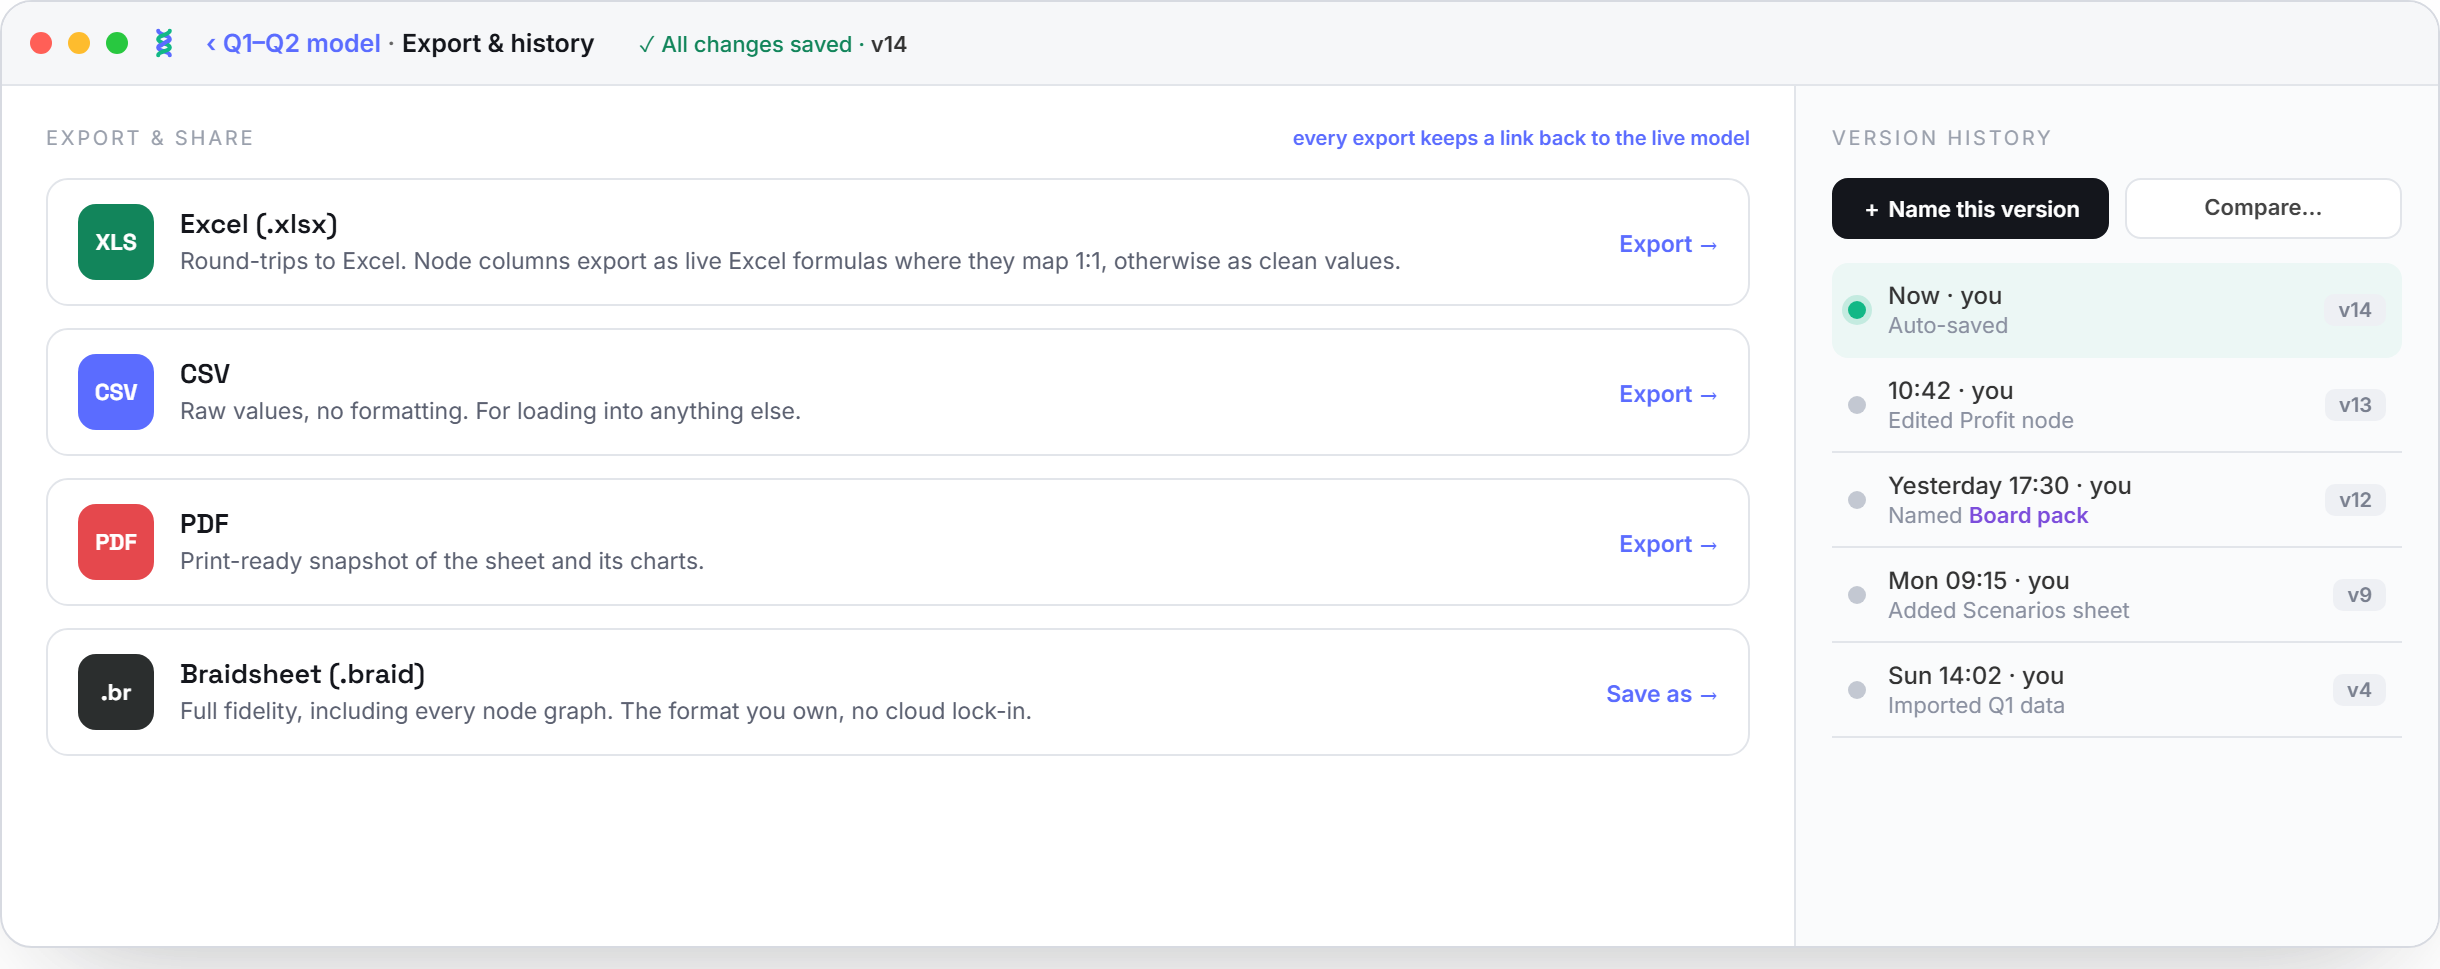
Everything is auto-saved and versioned. Name a milestone, restore any point you like, and export cleanly to Excel, CSV or PDF when you need to hand it on. No more report_final_v4.
What we're shipping next
The desktop core is free and shipping today. The next chapter is the cloud, built to solve the other half of the spreadsheet problem: sooner or later, everyone ends up holding a different copy of the same file.
Braidsync
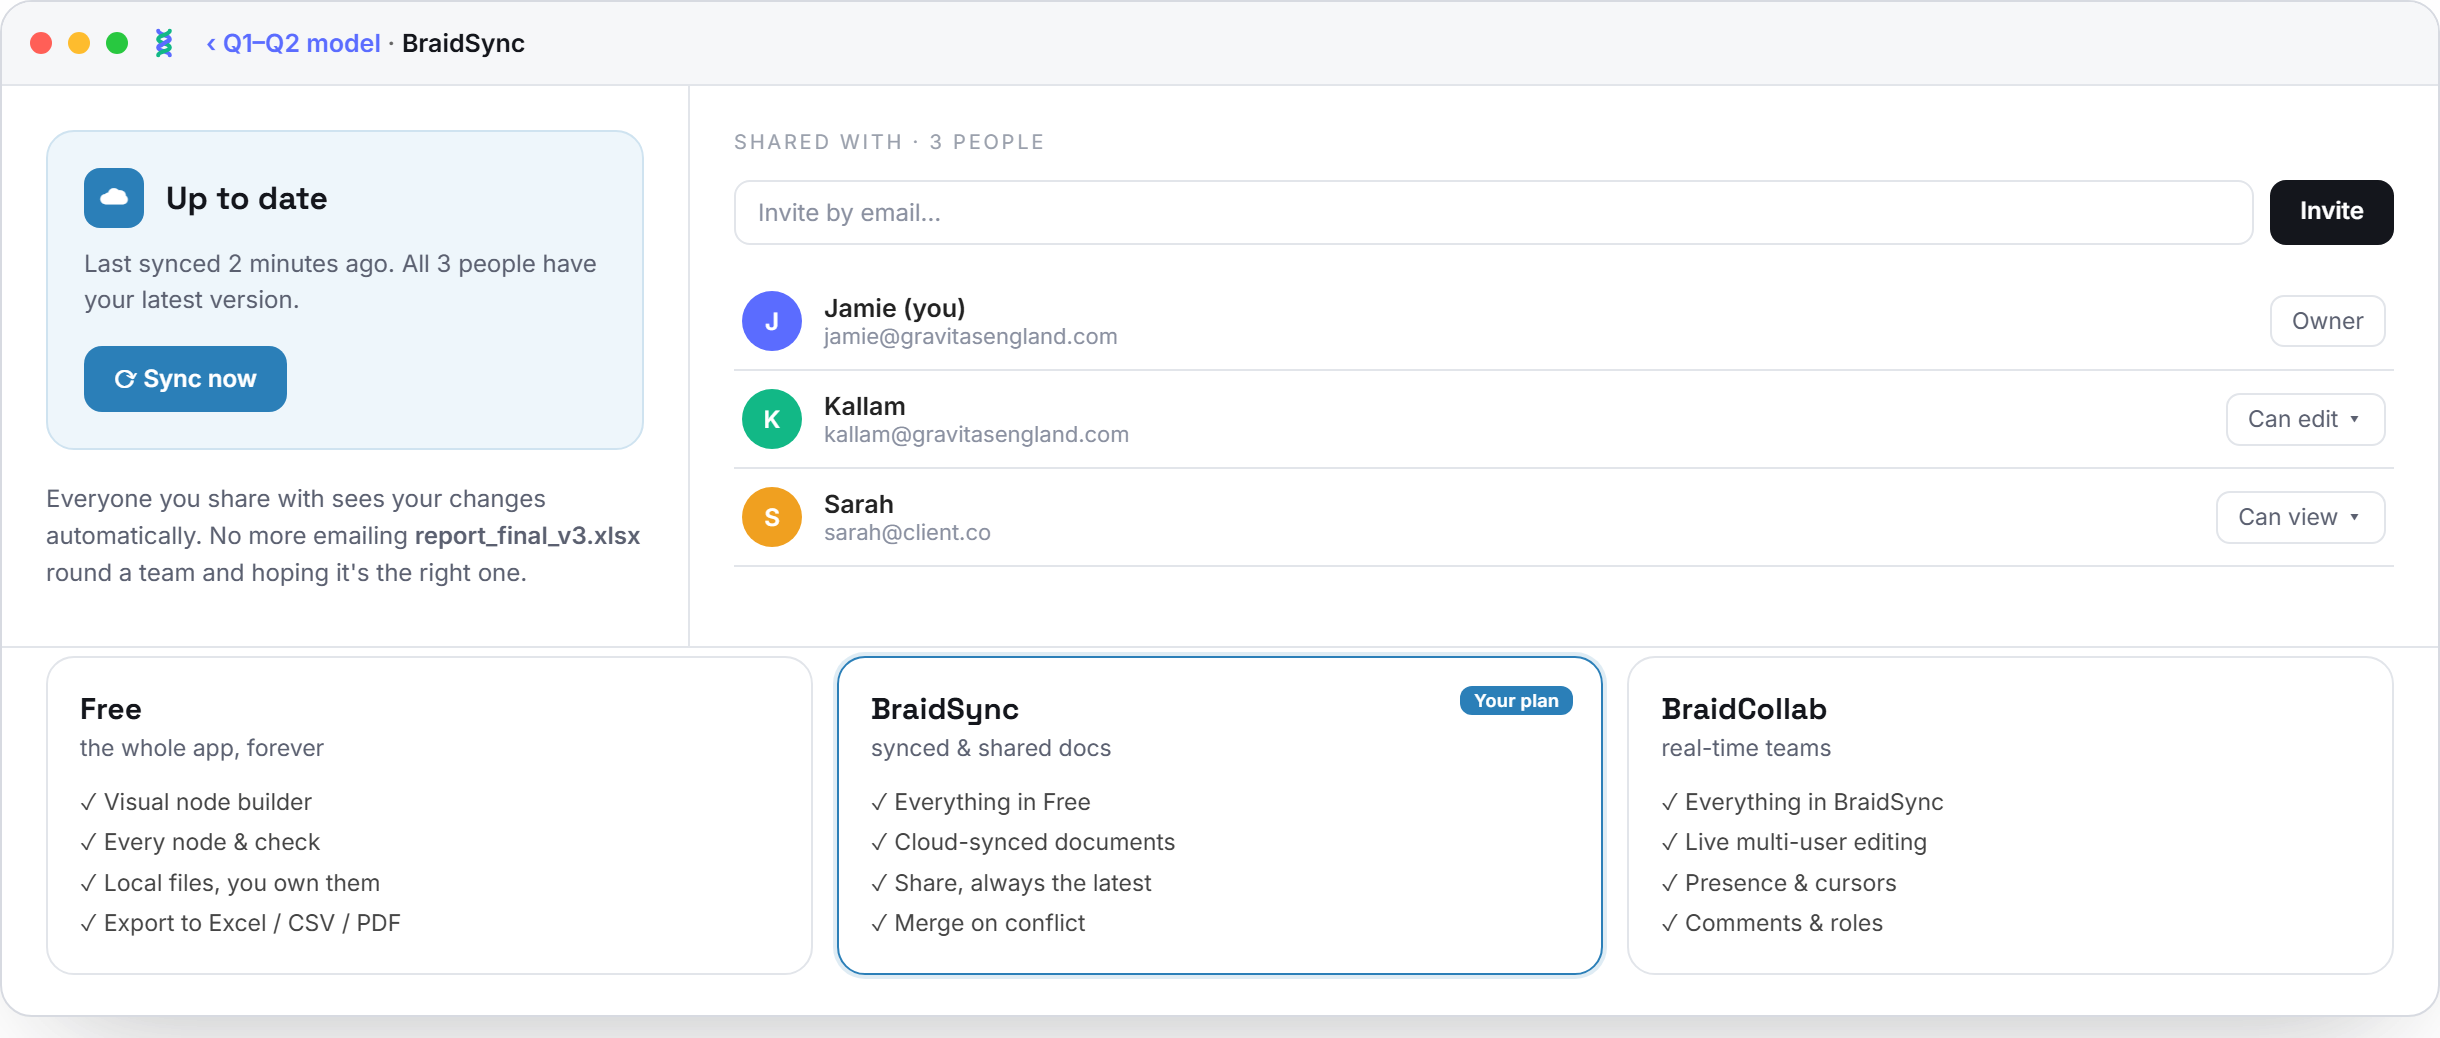
One document, always the latest version. Share it, and everyone you've shared with sees your changes automatically. If two people edit offline, a clear merge screen resolves it, so nobody's work is ever quietly overwritten.
Braidcollab
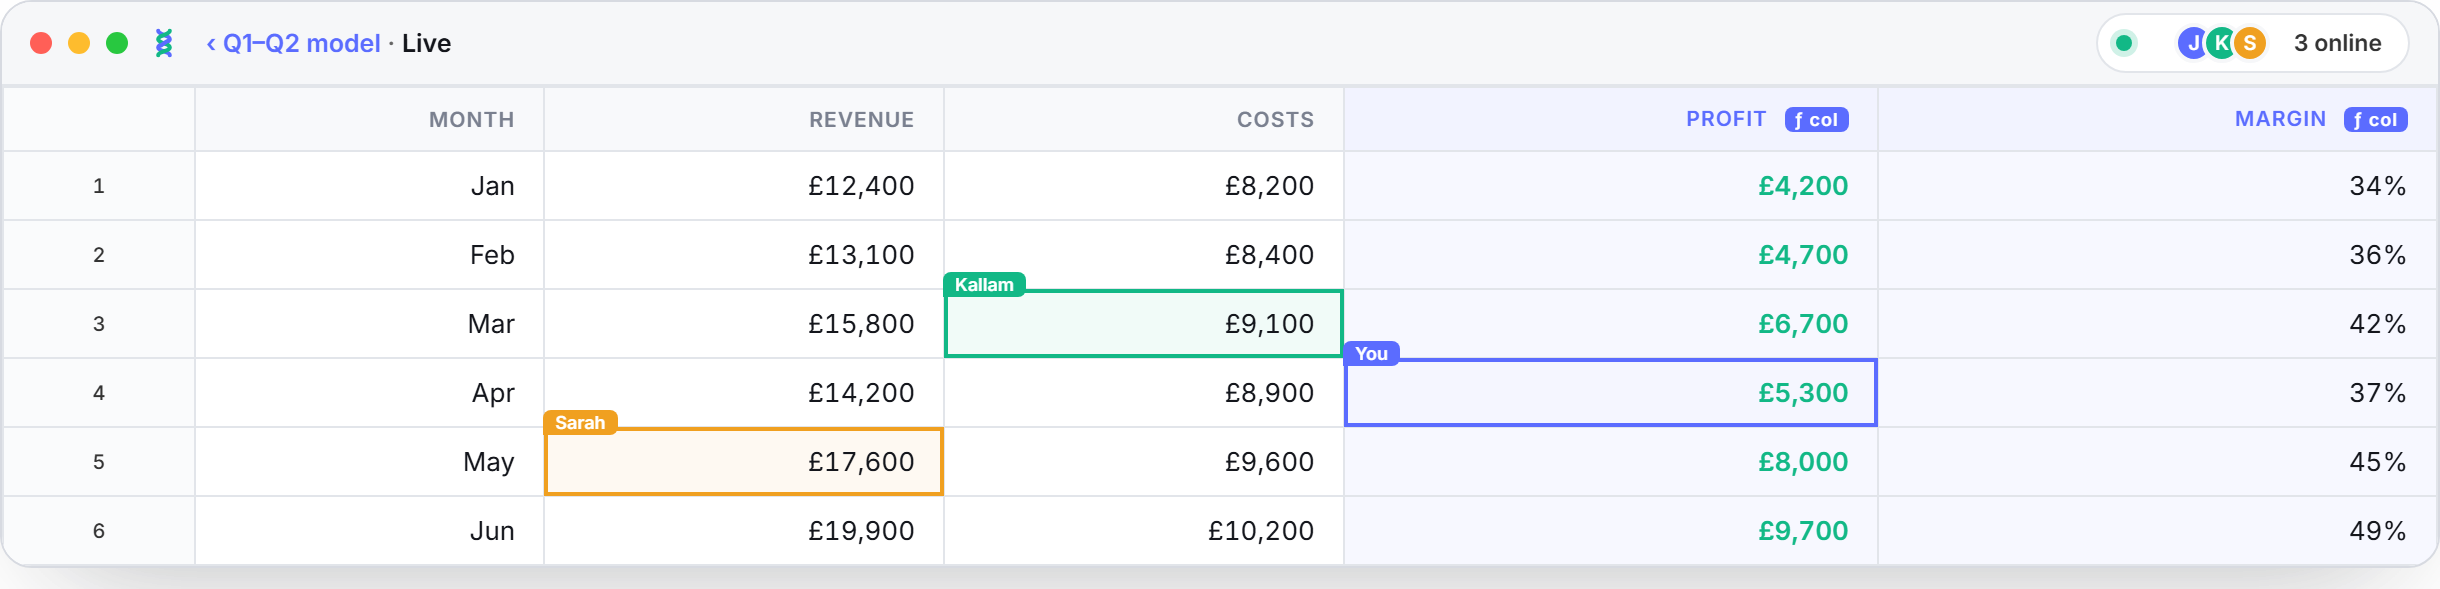
Real-time, multi-user editing on top of it: live cursors, presence, and a who's-online pill. The whole team in the same sheet at once, with no files passing back and forth.
The first of many
Braidsheet is our answer, built around four stubborn convictions:
- Make the logic visual, so a spreadsheet's power stops being a specialist skill.
- Never mangle your data, so an ID or a leading zero is exactly what you typed.
- Catch mistakes before they cost you, with checks the model runs on itself.
- And make the whole thing genuinely beautiful, because a tool you use every day should feel like it.
We started with the most boring software we could find, on purpose. If the approach holds here, on the tool everyone tolerates and nobody loves, it holds anywhere. Braidsheet is the proof. And it's only the first machine.