Product 01 — a Kind Machines product
braidsheet
The spreadsheet, reimagined. All of Excel's power, none of the syntax, and it never quietly mangles your data.
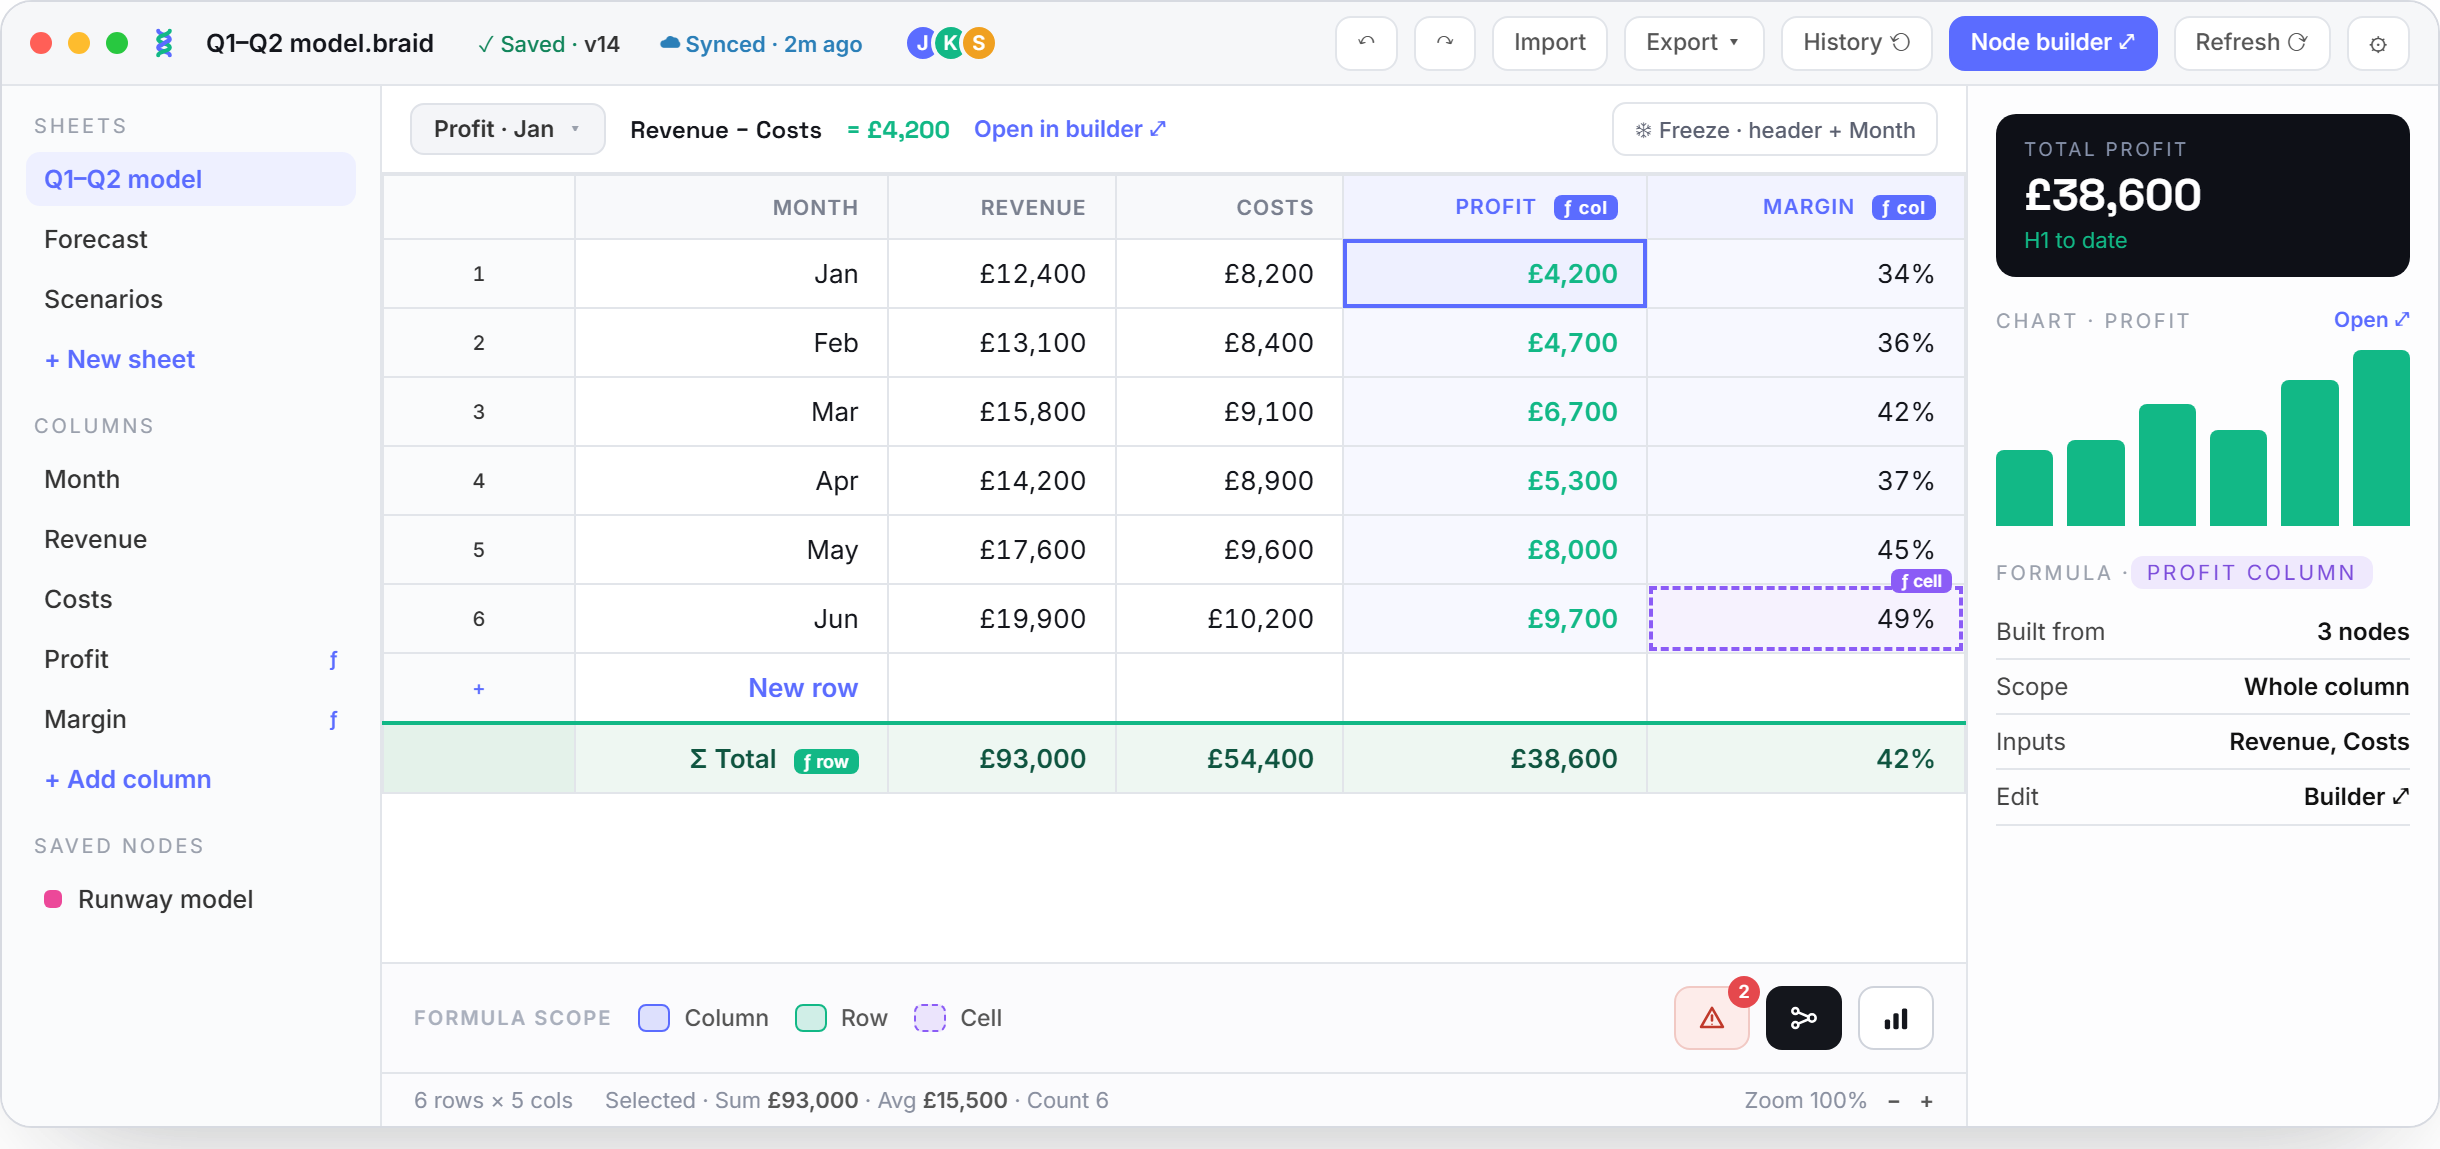
The spreadsheet, reimagined. All of Excel's power, none of the syntax, and it never quietly mangles your data.
Budgets, models, trackers, plans. The backbone of real work runs on a grid nobody actually chose, and quietly resents.
The power lives in formulas, and that's exactly where people give up. The moment a task needs more than a column of sums you're into nested IFs, dollar signs, and #REF! errors that explain nothing about what broke.
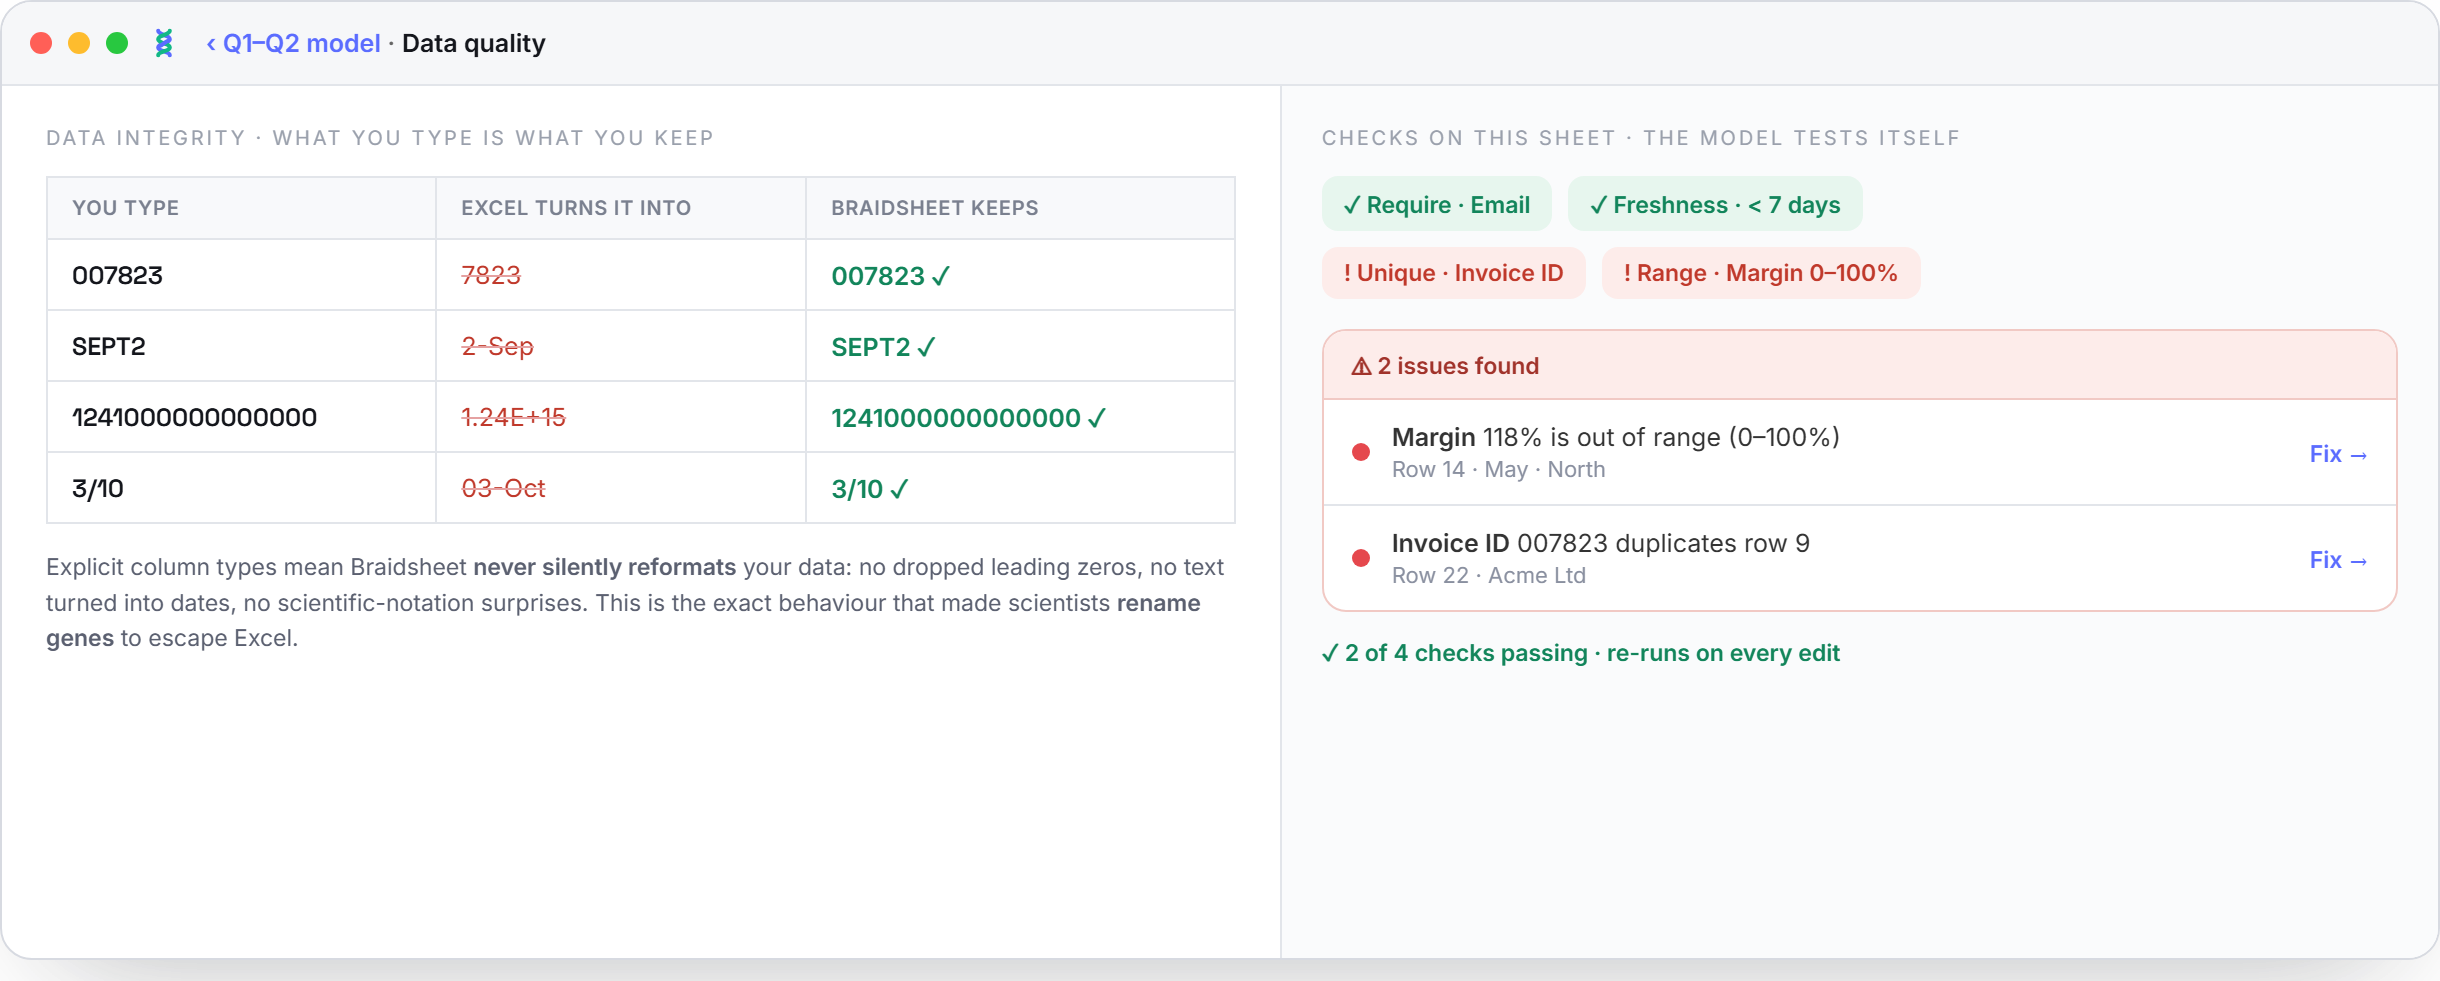
Worse, the tool works against you. It silently turns IDs into dates, strips leading zeros, and rounds numbers into scientific notation. And nothing ever checks itself, so mistakes just sit there, quietly trusted.
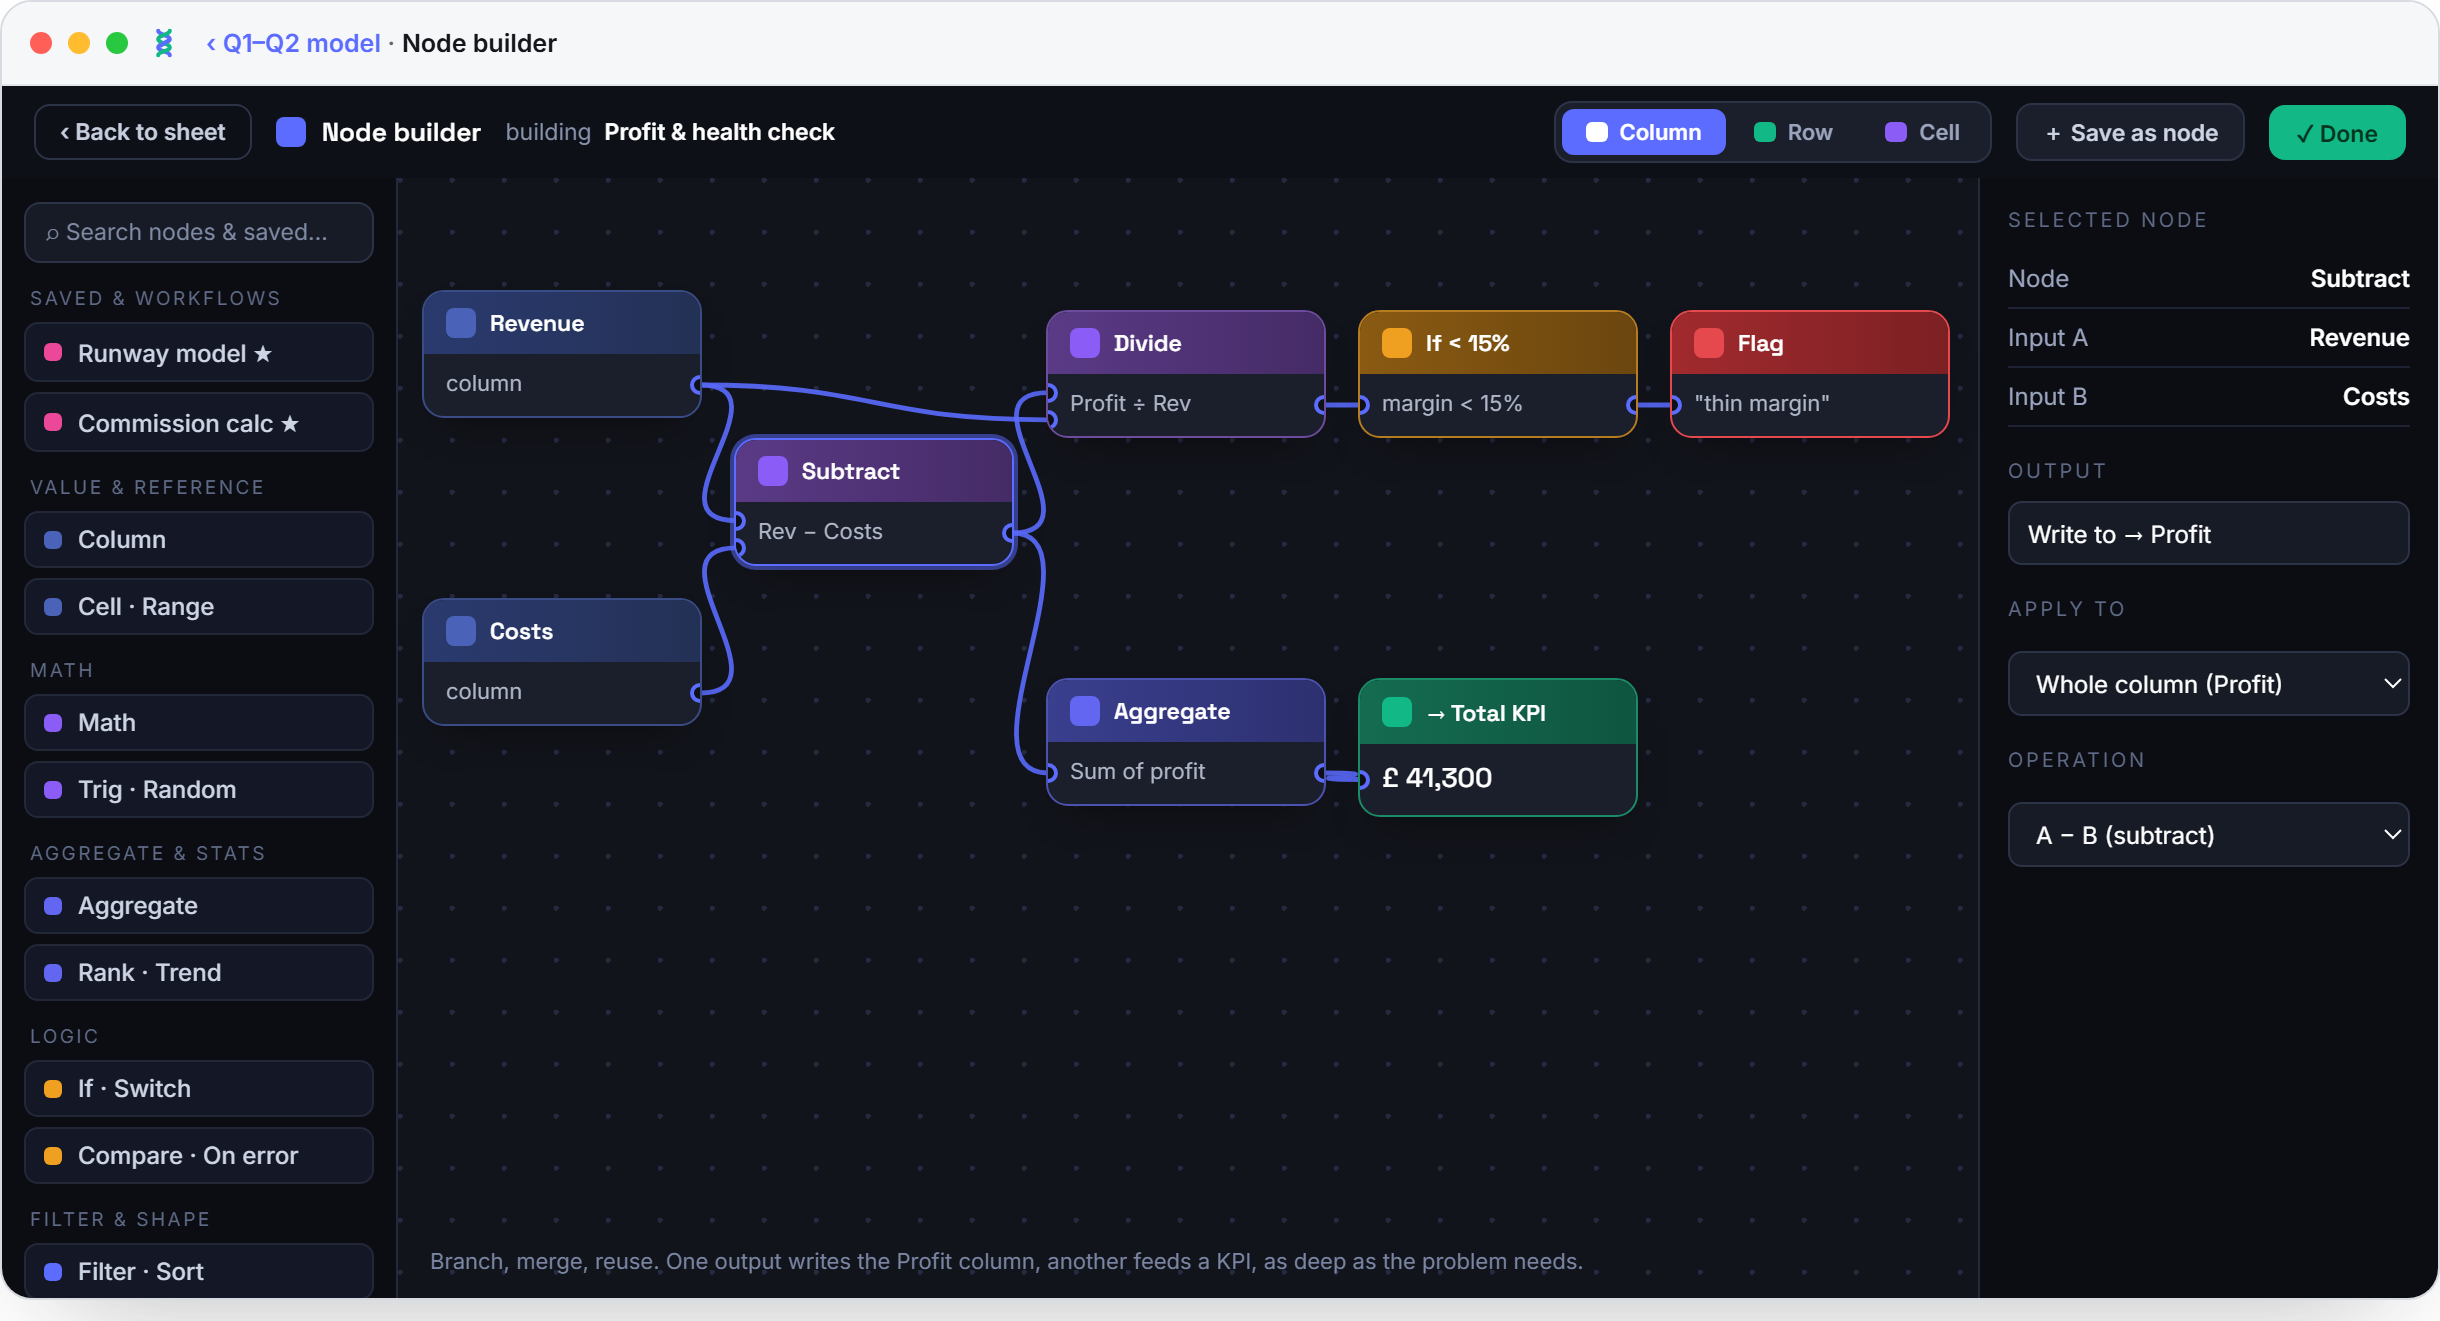
The logic was never the problem. Anyone can think "take revenue, subtract costs, and flag anything under fifteen percent." What breaks is translating that thought into cryptic syntax scattered across invisible cells.
The most powerful part of a spreadsheet is also the least accessible part. So we didn't remove the power. We changed how you reach it.
One idea the whole product hangs on: a node canvas, wired to your sheet. Drag data in, drop operations, connect them, and the result flows straight back into a column. Visual, traceable, reusable. A spreadsheet's full power, finally something you can see and follow.
The same care went into everything around the canvas.
Explicit types mean your IDs, dates and leading zeros stay exactly as you typed them. And check nodes let the model catch its own mistakes before they cost you.
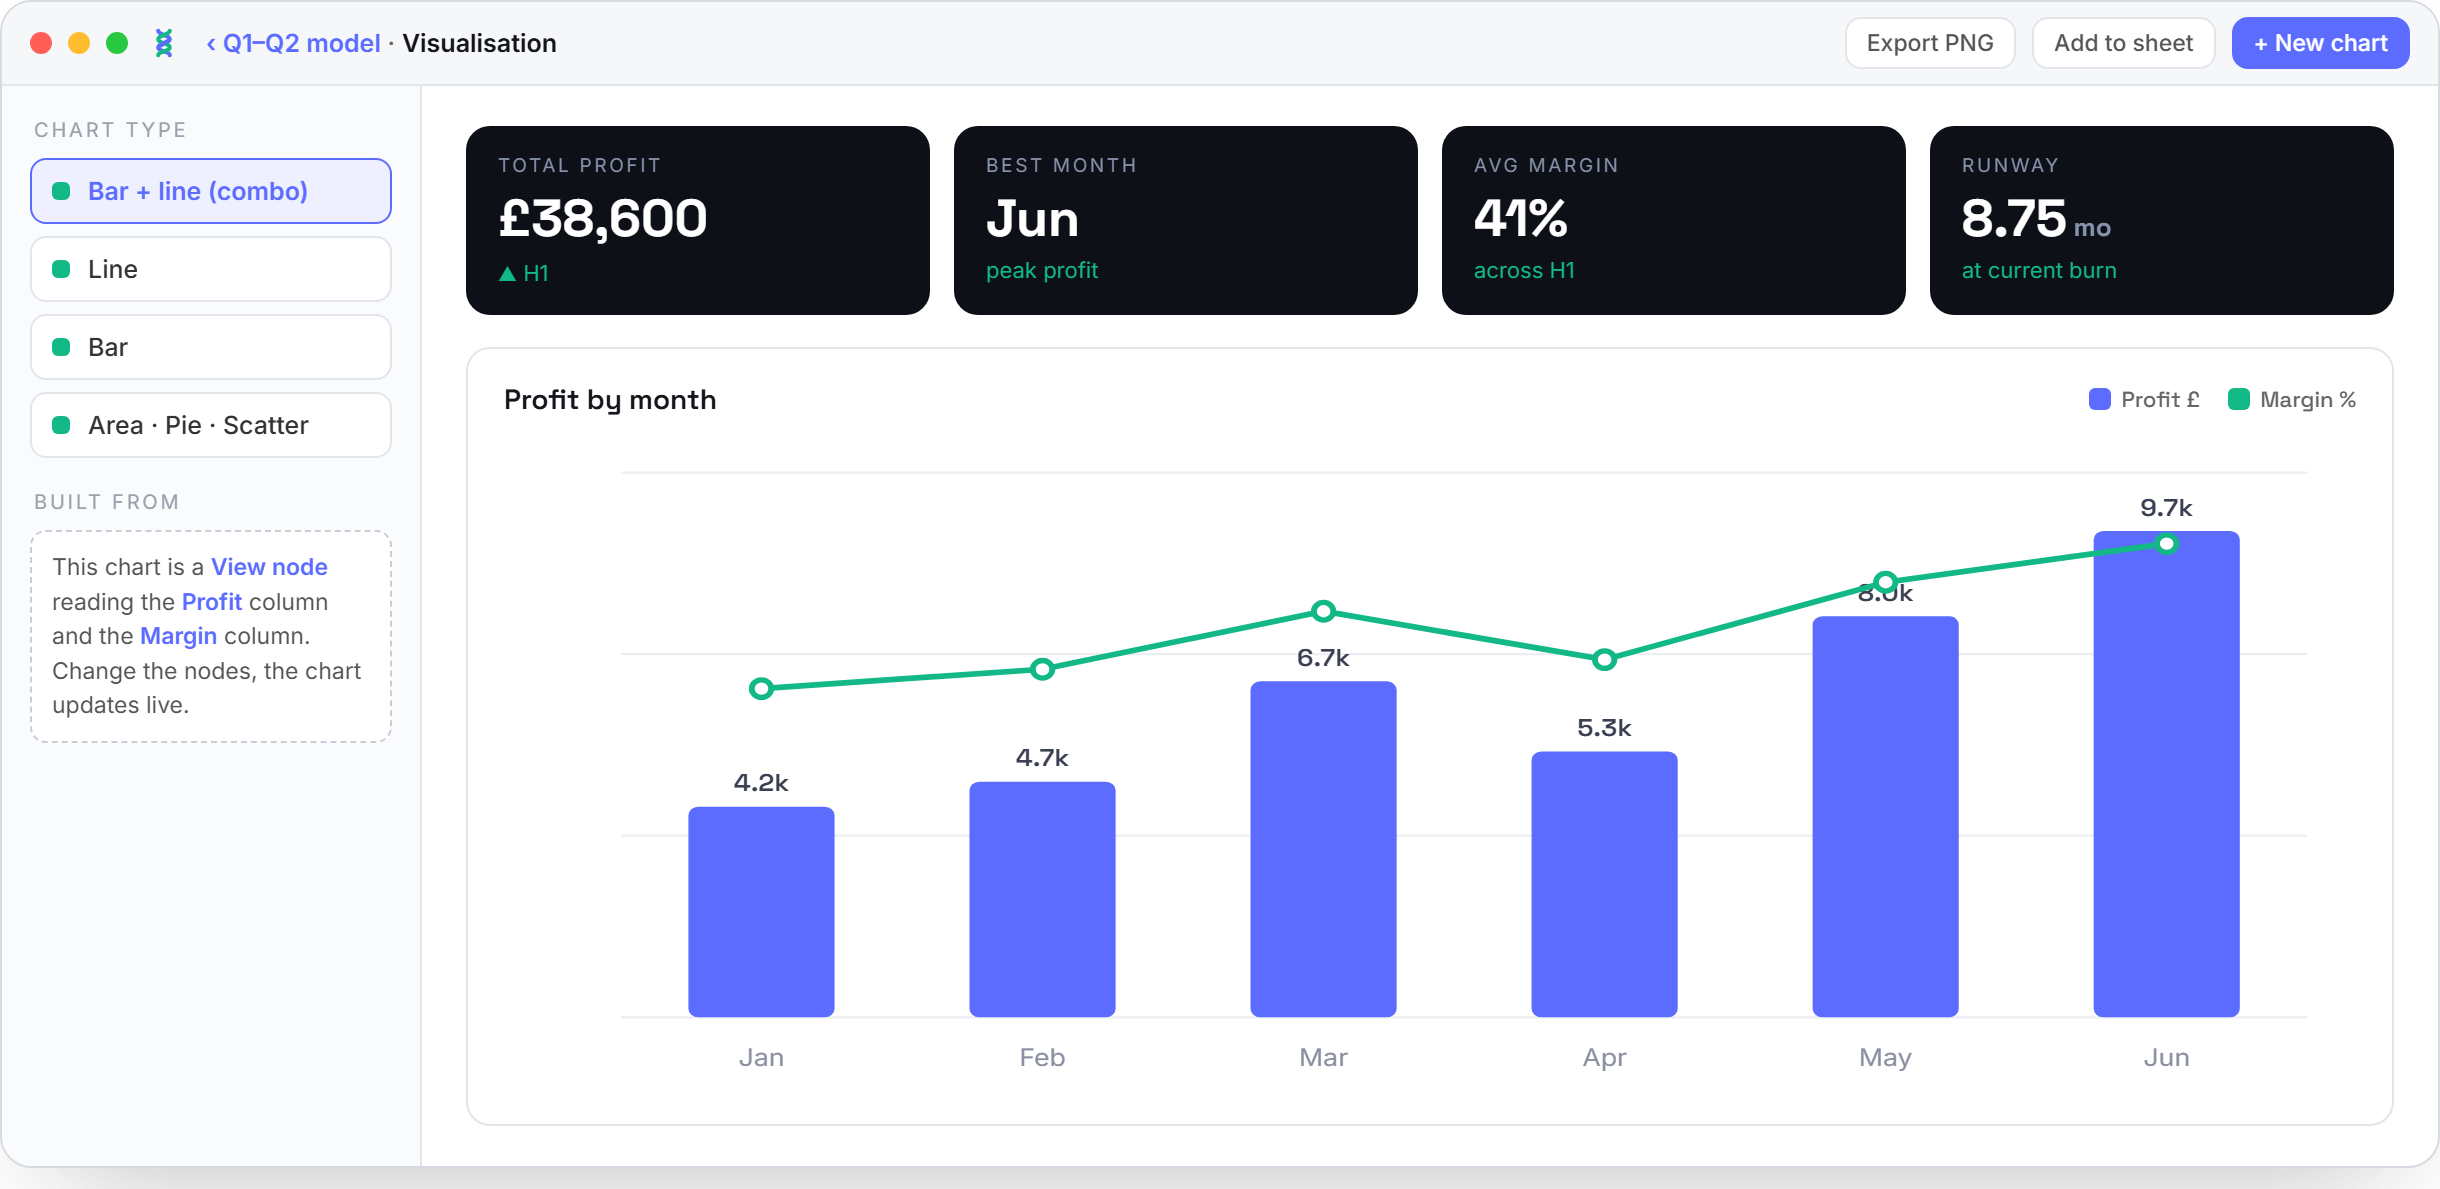
Charts and KPI cards are just nodes reading your columns, so they update the instant the numbers do. No copy-paste into a chart, no stale screenshots in a deck.
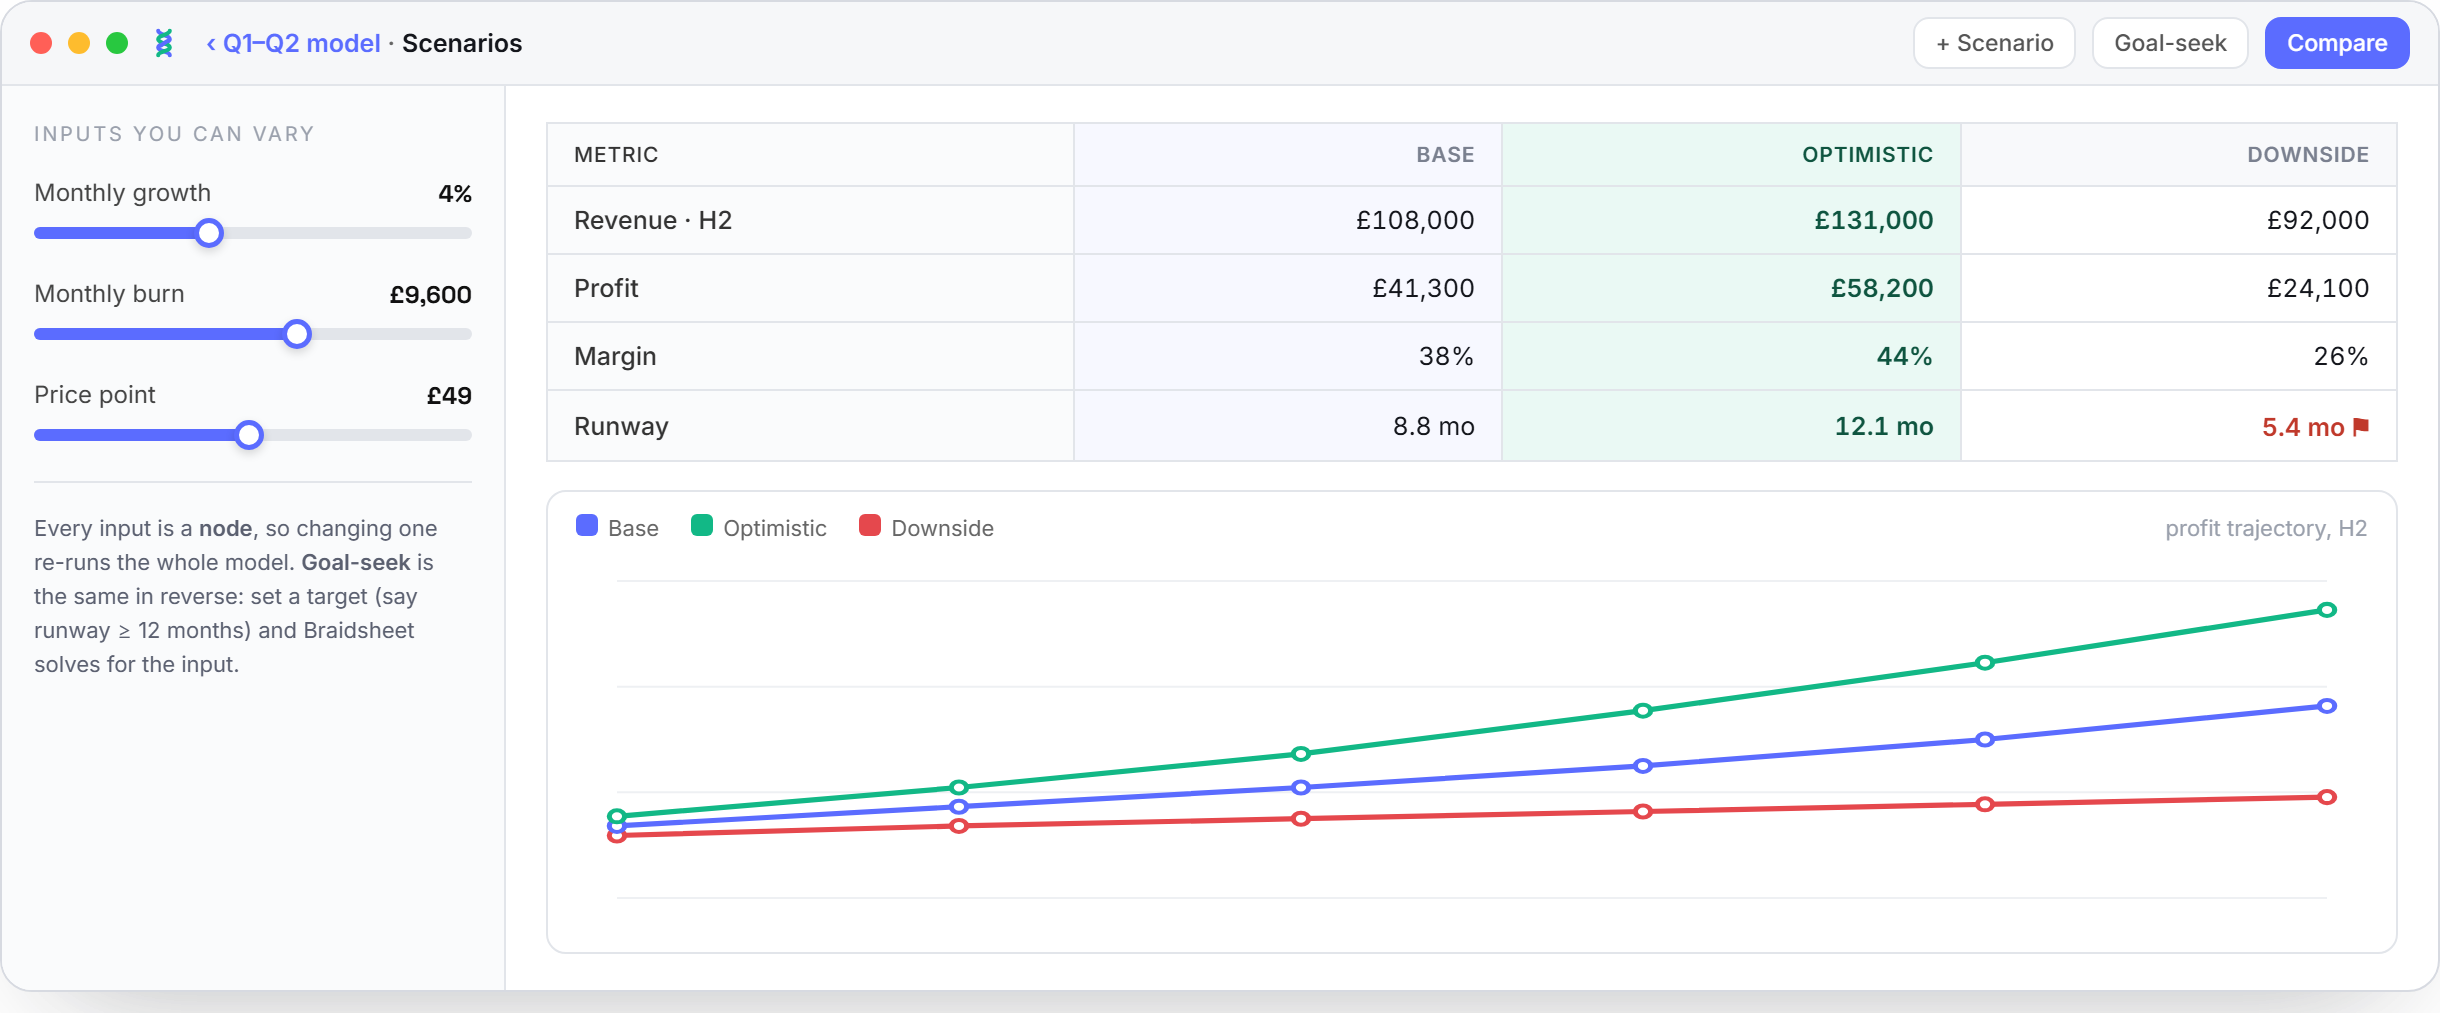
Change one input and compare Base, Optimistic and Downside side by side. Goal-seek runs it in reverse: name the target, and Braidsheet solves for the input.
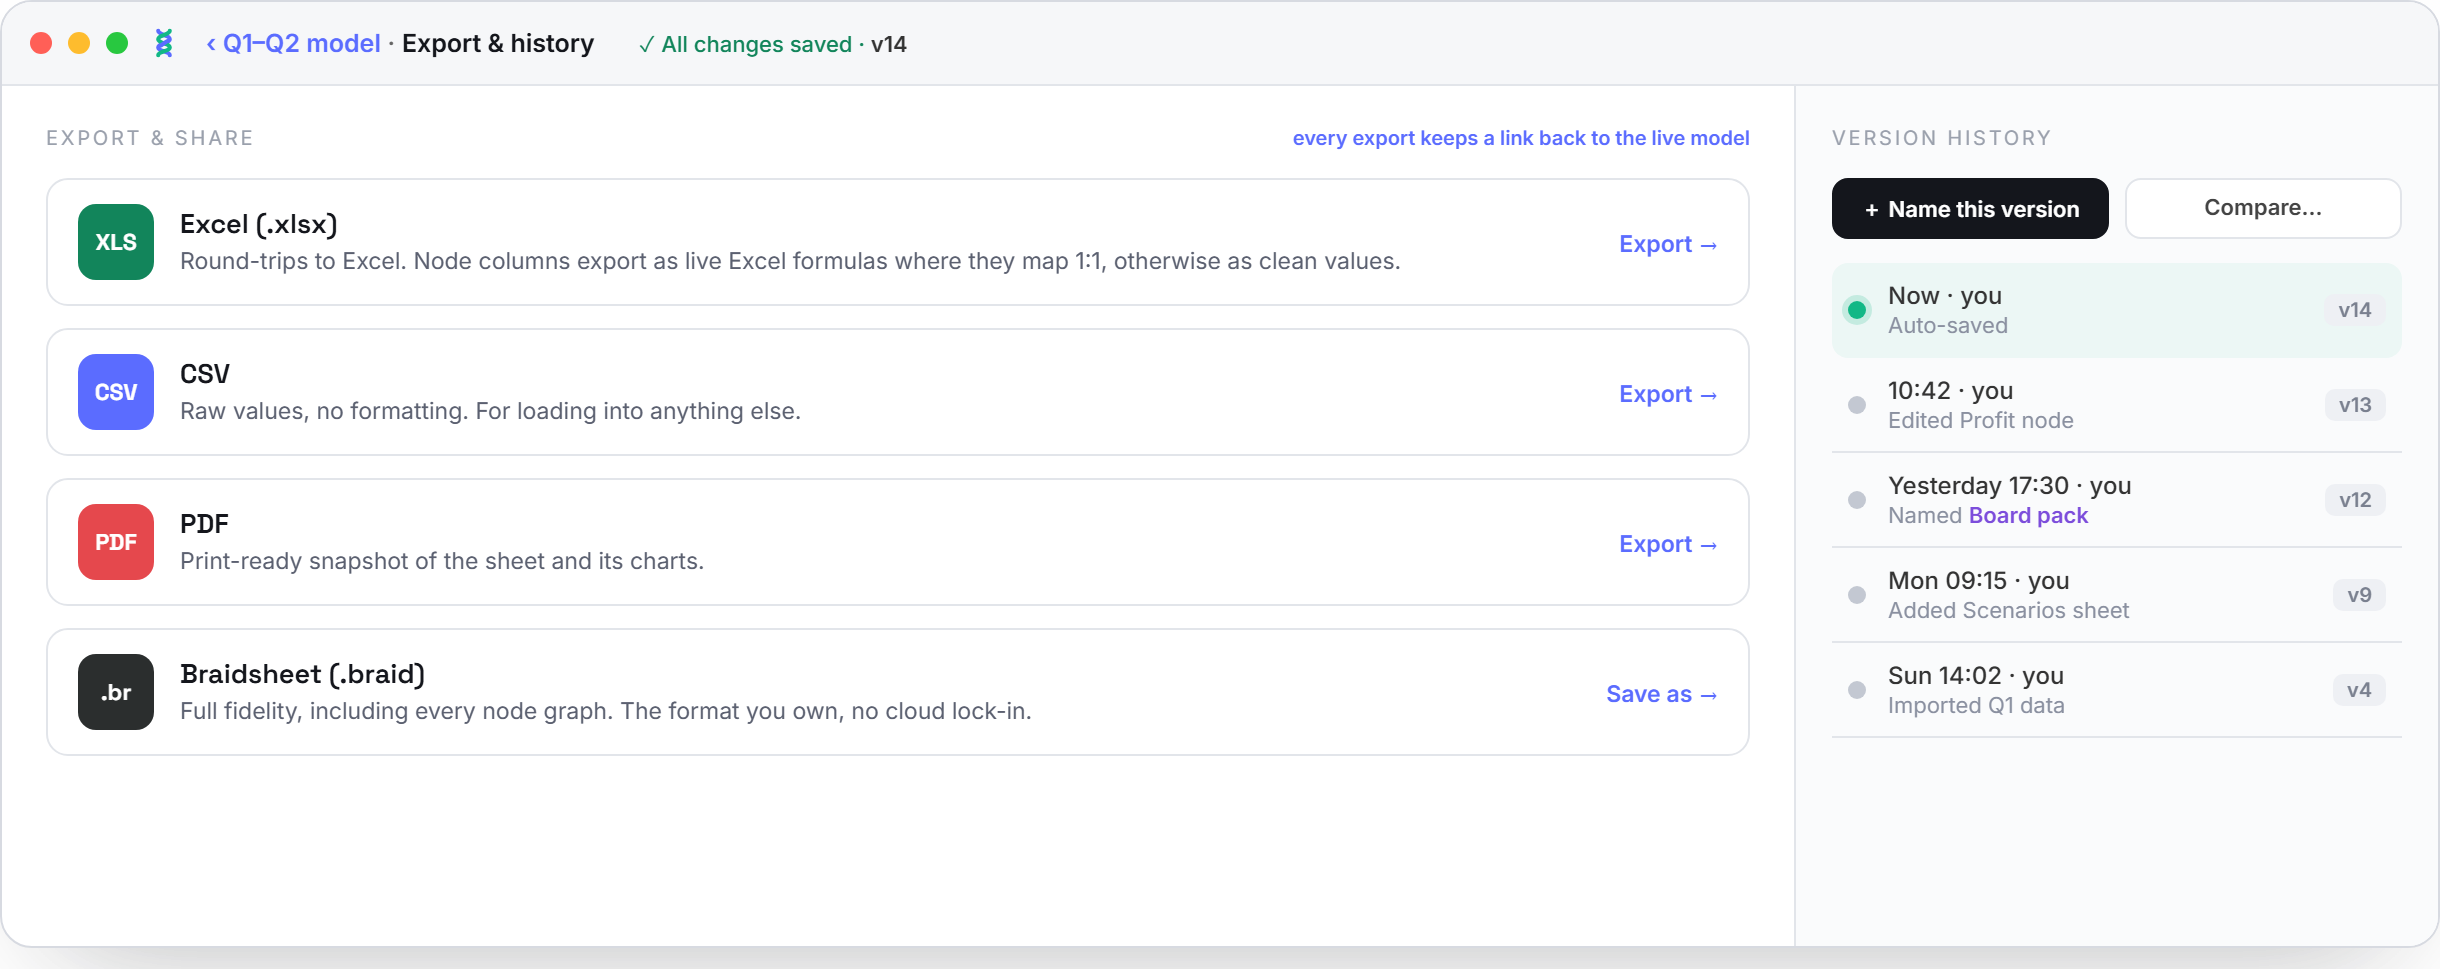
Everything is auto-saved and versioned, with named milestones you can restore, and clean export to Excel, CSV or PDF when you need to hand it on.
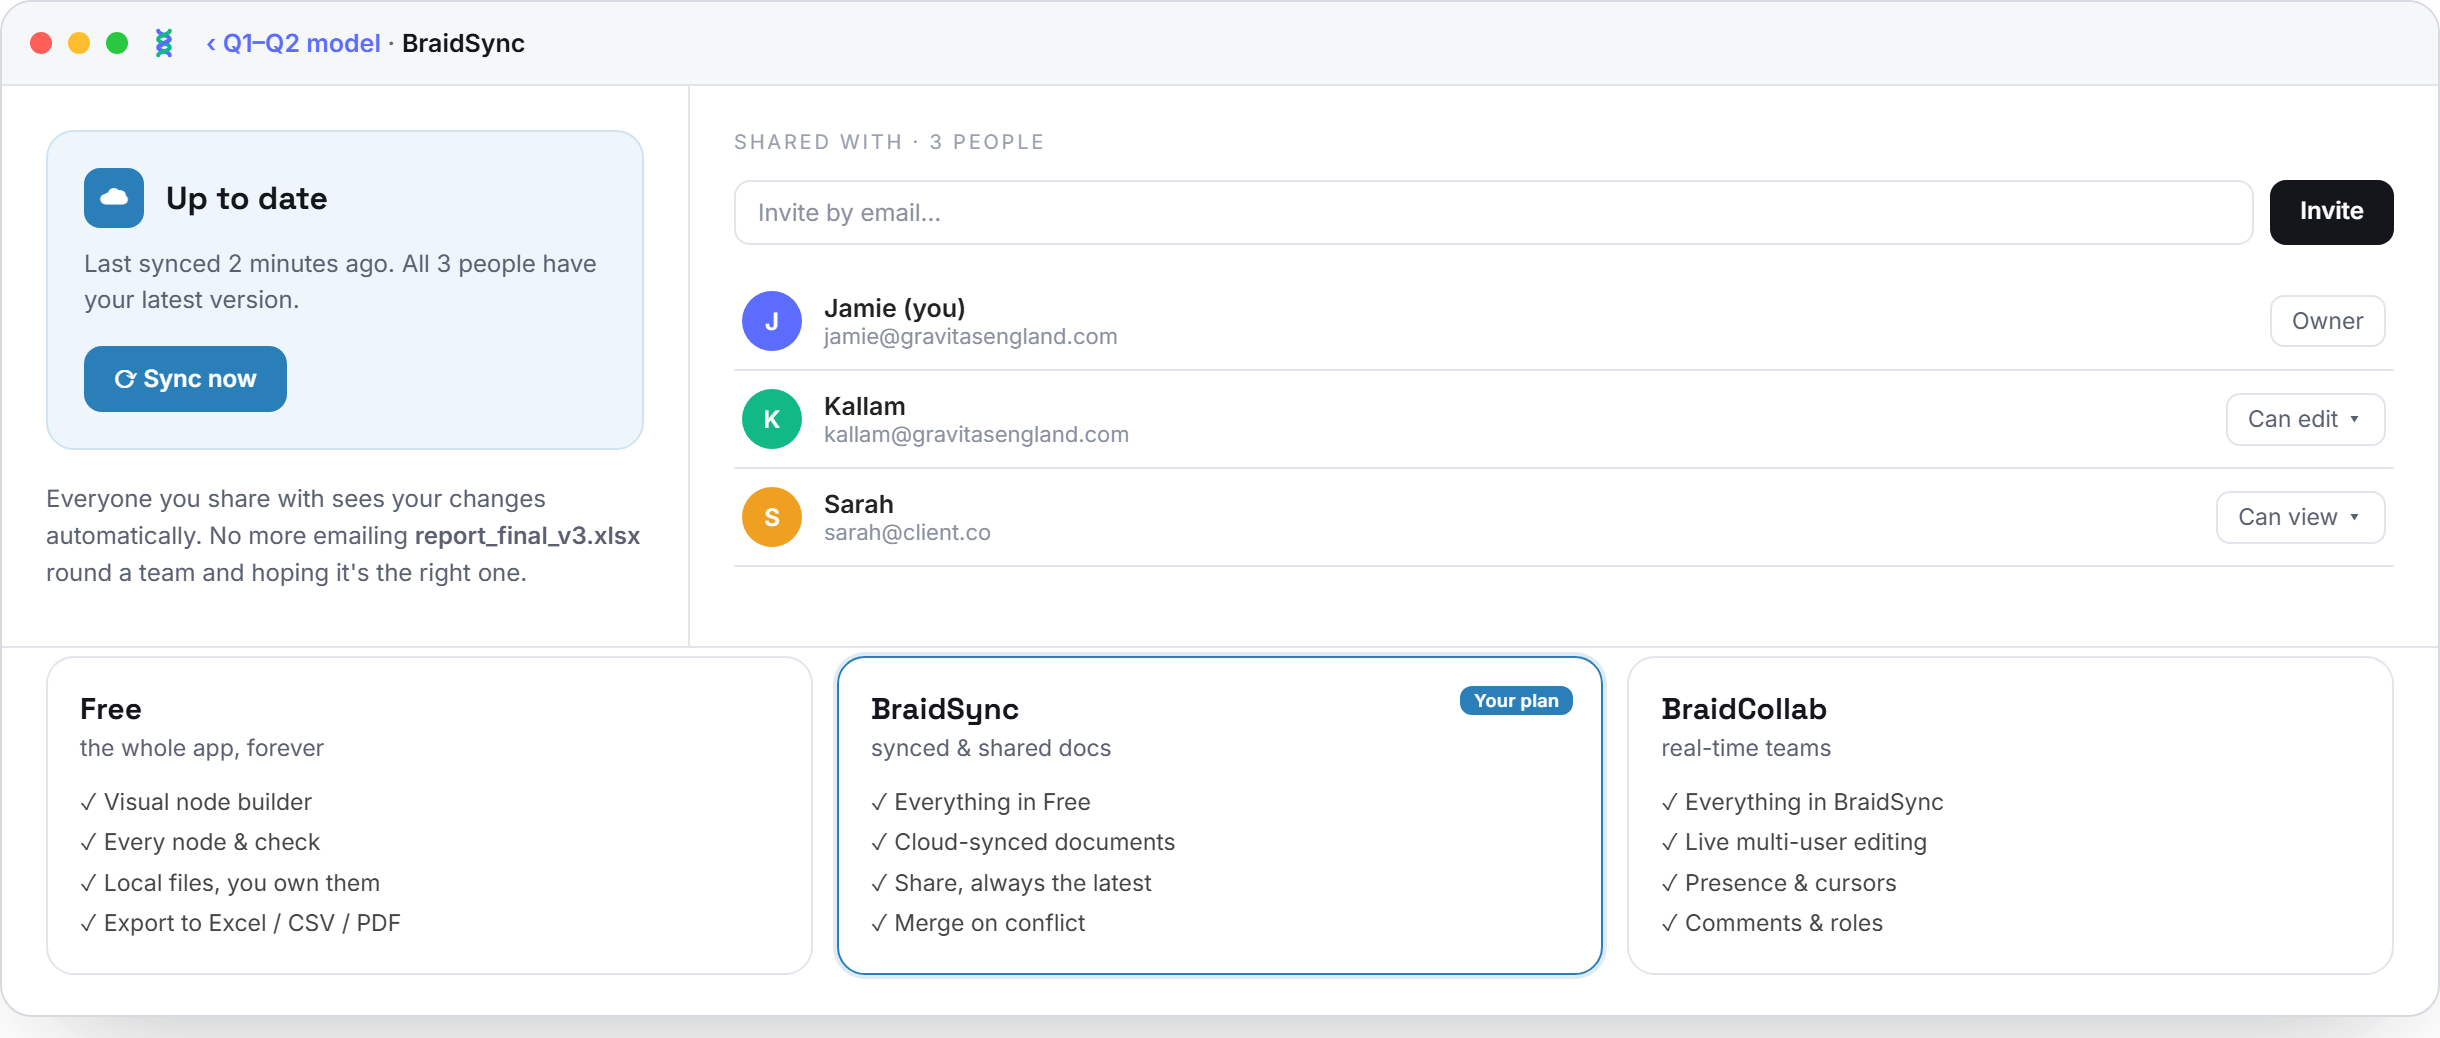
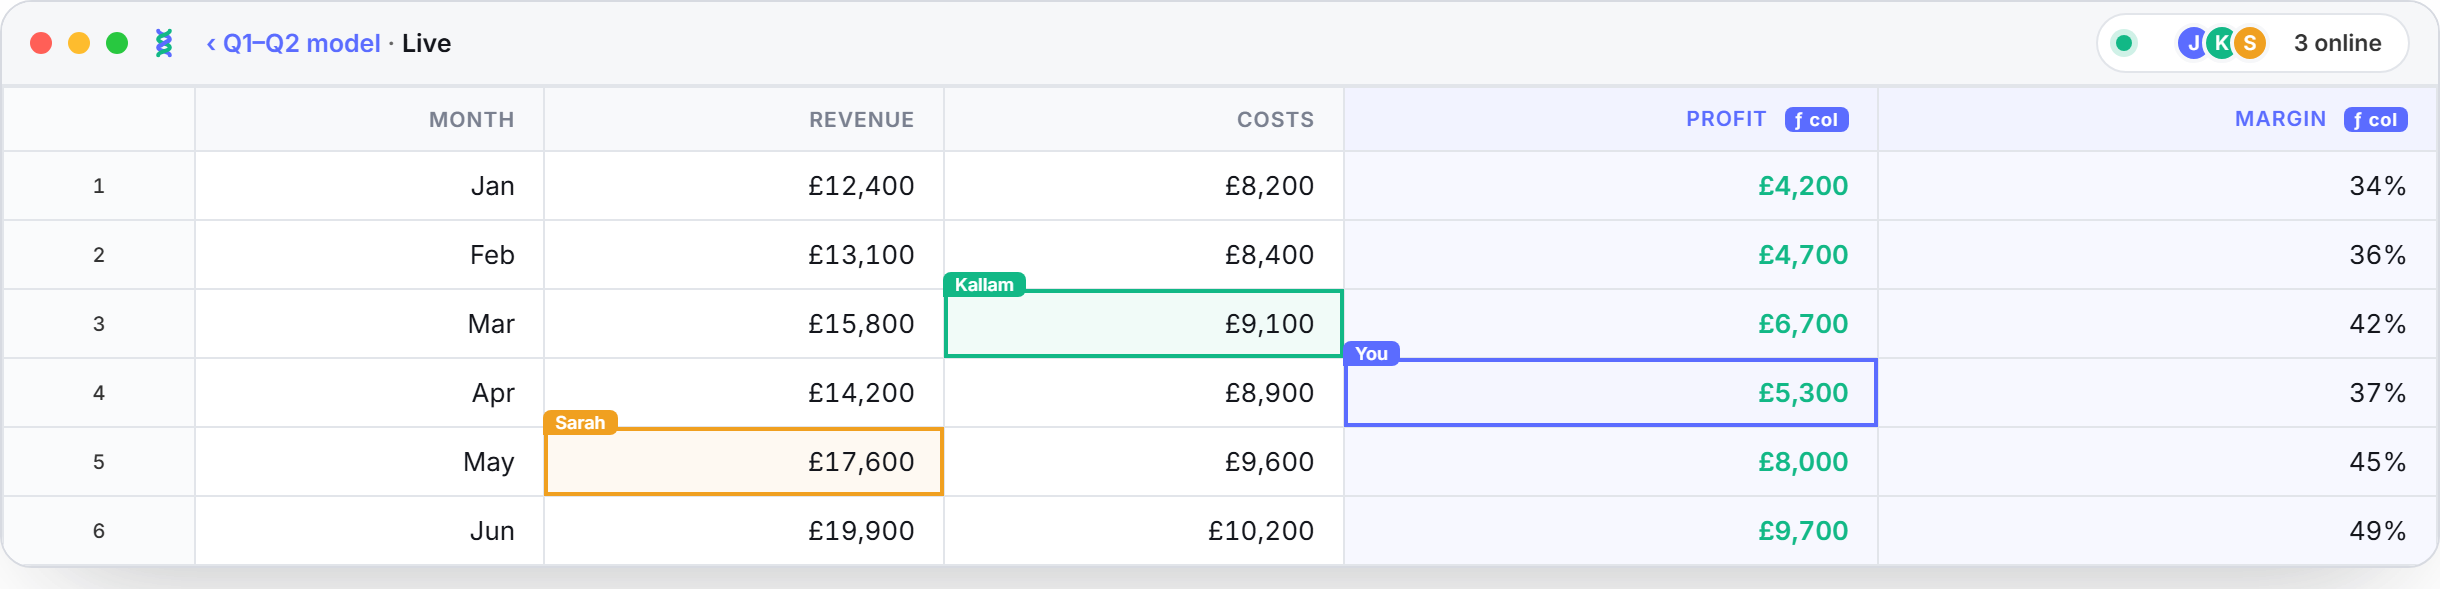
The desktop core is free and shipping. Next comes the half of the problem plain files never solve: everyone ends up with a different copy.
Get early access to Braidsheet, and a first look at what we build next.